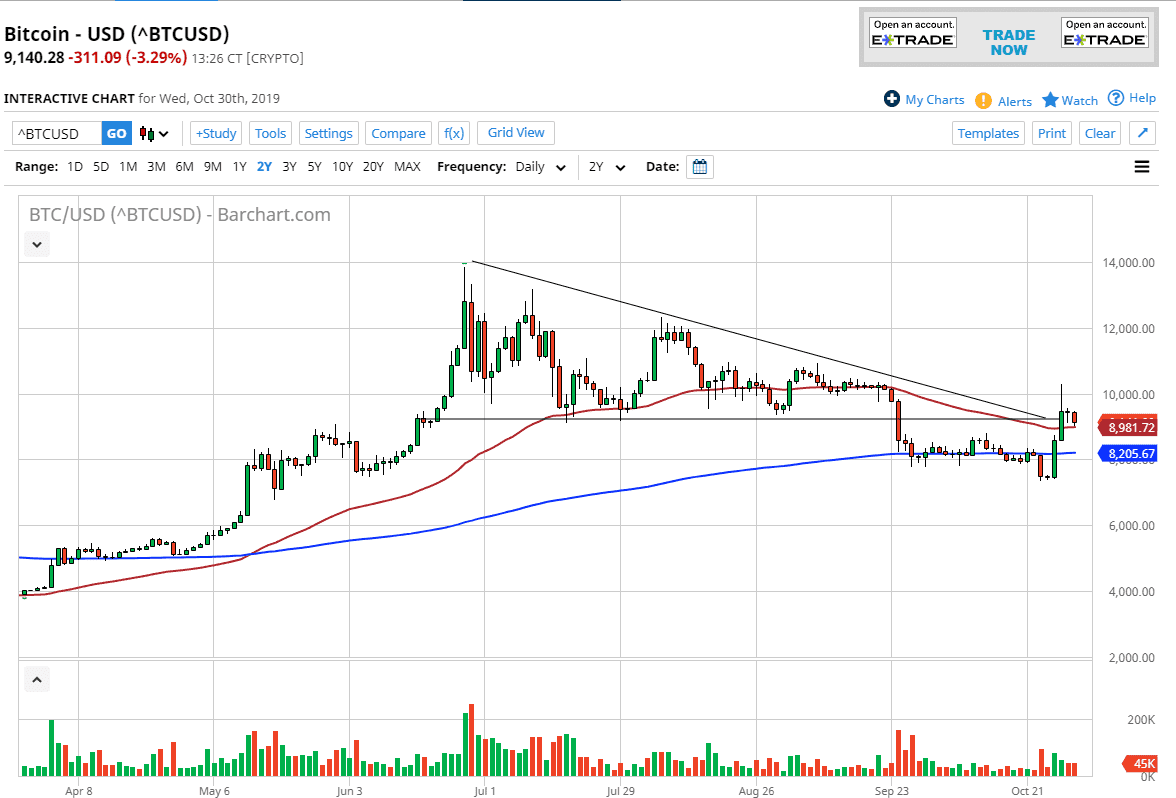
Bitcoin has pulled back a bit during trading on Wednesday in relatively quiet action. The market currently sits just above the 50 day EMA, which of course attracts a lot of attention by itself. That being said it’s likely that we will continue to see this market drift a little bit lower due to the fact that the market has broken higher but then simply sat still after that. The fact that the $10,000 level has remained intact is of course a sign as we could not break above it for a bigger move.
If you remember reading my analysis from a couple of weeks ago, I suggested that the market needed to close above the $10,000 level in order to become bullish. At this point it looks like that has failed to happen, and now that we are at basically what is the bottom of the descending triangle, we should start to see more bearish pressure given enough time. Ultimately, market participants will continue to see a lot of negative pressure here is simply due to a lack of interest. If the market were to finally close above that $10,000 level, then obviously it would be a very bullish sign.
Ultimately, I think that it’s likely that we continue to drip down towards the 200 day EMA, which is closer to the 8200 level. The fact that the Federal Reserve was able to cut interest rates during the trading session, and then come out with a relatively hawkish statement has put a bit more upward pressure on the value of the US dollar, and that of course is yet another thing to work against the value of Bitcoin. If Bitcoin could not accelerate to the upside when central banks were dovish, it certainly will struggle to go higher in the face of the Federal Reserve stabilizing its interest rates.
Looking at this chart, I fully anticipate that a breakdown below the 50 day EMA could be yet another signal to start selling, as the market would be simply continuing the breakdown that we had started once we broke down below the bottom of the descending triangle just above. With that, the market looks like the reaction to the Chinese wanting to invest in block chain was overdone as expected. However, a break above that crucial $10,000 level on a daily close could change things and send the market looking towards the $12,000 level.

