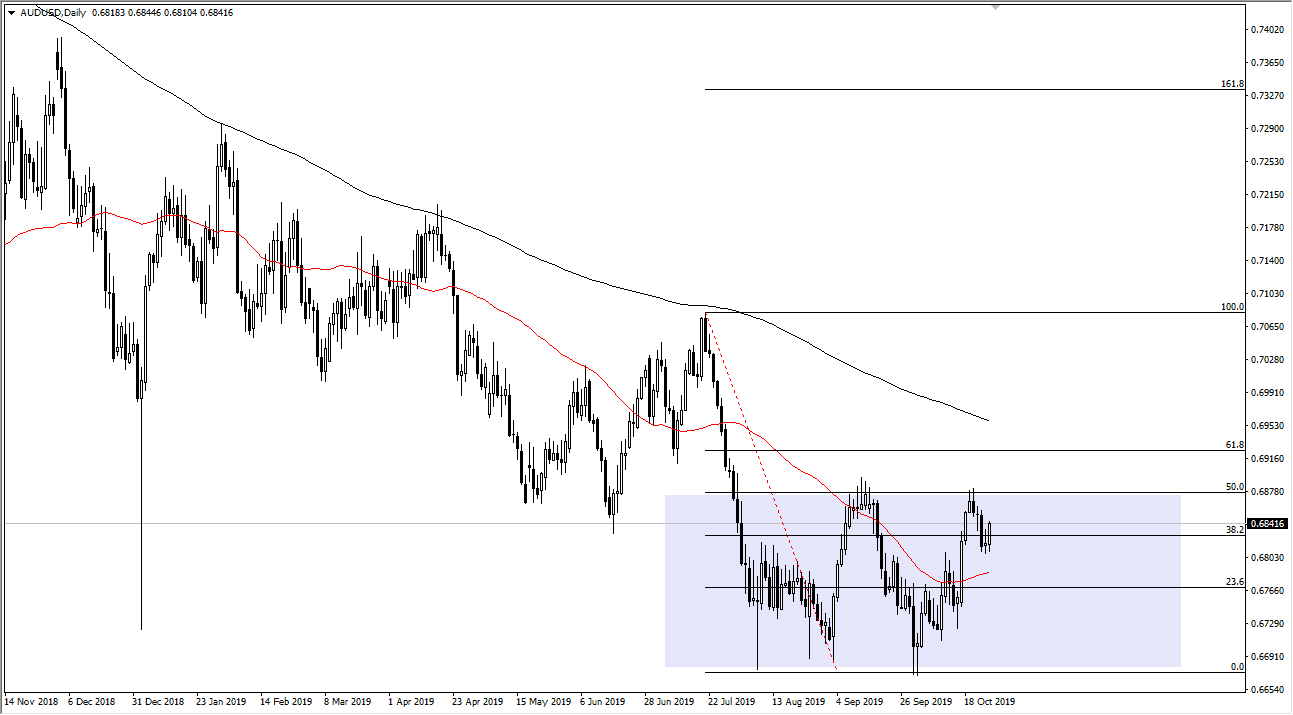
The Australian dollar has rallied a bit during the training session on Monday, breaking above the top of a shooting star from the previous session on Friday. With this being the case it’s very likely that the market is going to continue to catch short traders on the wrong side and should push this market to the upside and towards the 0.69 handle. That is an area that has offered a lot of resistance recently, and therefore it would make sense that we go to test that area. It also makes quite a bit of sense that we would break down from there once we get closer to it again.
That being said, if the market did break above the 0.69 handle, then the market maker looking towards the 200 day EMA. A break above there is technically a trend change and should bring in quite a bit more buying pressure. However, it’s very likely that the move that we see will be predicated more or less on headlines coming out of the US/China trade situation. Although they are getting ready to sign “Phase 1”, there is still a lot of work to do to actually finalize a trade deal. Yes, the attitude is getting a bit better, but there are still quite a few issues out there that could derail the entire situation.
The 50 day EMA is underneath painted in red, while the 200 day EMA as above. The market of course will go back and forth between these two levels, but if we were to break down below the candlestick from the Friday session, the market is very likely to reach towards the 0.6750 level next. Overall, expect a lot of choppiness going forward, and it’s likely that short-term traders will be attracted to this market. That being said, it is only a matter of time before we get some type of impulsive candle that the market can follow, and therefore by reason of deduction we can start to put money to work for a longer-term move. Until then, you are probably going to have to settle for 20 or 30 pips at a time. If risk does pick up, then this will have proven to become a bit of a bottoming pattern, but it’s far too early to feel comfortable simply buying at these levels, regardless of how historically low they truly are.

