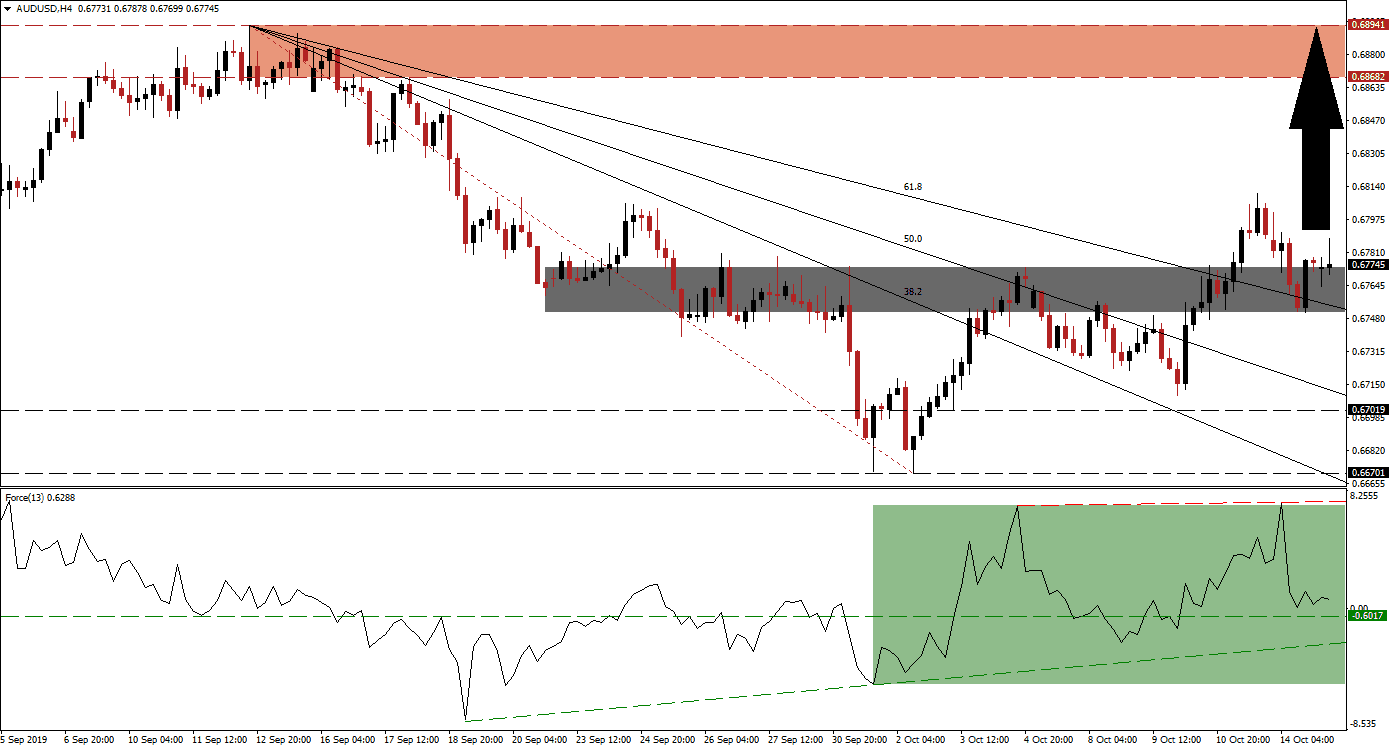
After the release of the RBA minutes from its latest meeting, the Australian Dollar was able to maintain its bullish bias. The central bank noted that risks remain elevated, but that it also wanted to keep some ammunition for potential future shocks which could mean that after the most recent interest rate cut of 25 basis points to 0.75% there could be a pause. The AUD/USD remains well supported above its 61.8 Fibonacci Retracement Fan Support Level and at the top range of its short-term support zone from where more upside is possible.
The Force Index, a next generation technical indicator, indicates that there is a bullish bias in this currency pair after the AUD/USD completed a breakout sequence which resulted in a series of higher highs and higher lows. The Force Index mirrored this pattern and its ascending support level provides a solid floor. As price action advanced, this technical indicator pushed above its horizontal resistance level and turned it into support. As the Force Index remains in positive territory and has formed a higher high, which is marked by the green rectangle, a renewed push to the upside is expected. You can learn more about the Fibonacci Retracement Fan, the Force Index and the Support Zone here.
Following multiple breakouts in the AUD/USD, which took price action through its entire Fibonacci Retracement Fan sequence turning it from resistance to support, this currency pair reached an intra-day high of 0.68101. It then reversed back down into its 61.8 Fibonacci Retracement Fan Support Level, confirmed it and pushed higher once again. This additionally confirmed its short-term support zone which is located between 0.67508 and 0.67730 as marked by the grey rectangle. As long as the Force Index will remain above its ascending support level, the uptrend remains intact.
Volatility is expected to remain elevated as optimism about the partial US-China trade deal, which is more of a temporary tariff truce than a trade deal, is fading and reality sets in. The Australian Dollar is the top Chinese Yuan proxy currency and its economy very dependent on China. Given the current bullish conditions, the AUD/USD is expected to accelerate to the upside and a sustained move above the 0.68101 level will clear the path into its resistance zone which is located between 0.68682 and 0.68941 as marked by the red rectangle. You can learn more about a Breakout, a Breakdown and the Resistance Zone here.
AUD/USD Technical Trading Set-Up - Breakout Extension Scenario
Long Entry @ 0.67750
Take Profit @ 0.68800
Stop Loss @ 0.67450
Upside Potential: 105 pips
Downside Risk: 30 pips
Risk/Reward Ratio: 3.50
In case price action will pressure its short-term support zone to the downside, which currently houses its descending 61.8 Fibonacci Retracement Fan Support Level , and if the Force Index completes a double breakdown below its horizontal as well as ascending support level, the AUD/USD may correct back down into its long-term support zone from where rally originated. This zone is located between 0.66701 and 0.67019 which should be considered and excellent buying opportunity.
AUD/USD Technical Trading Set-Up - Breakdown Scenario
Short Entry @ 0.67300
Take Profit @ 0.66900
Stop Loss @ 0.67500
Downside Potential: 40 pips
Upside Risk: 20 pips
Risk/Reward Ratio: 2.00

