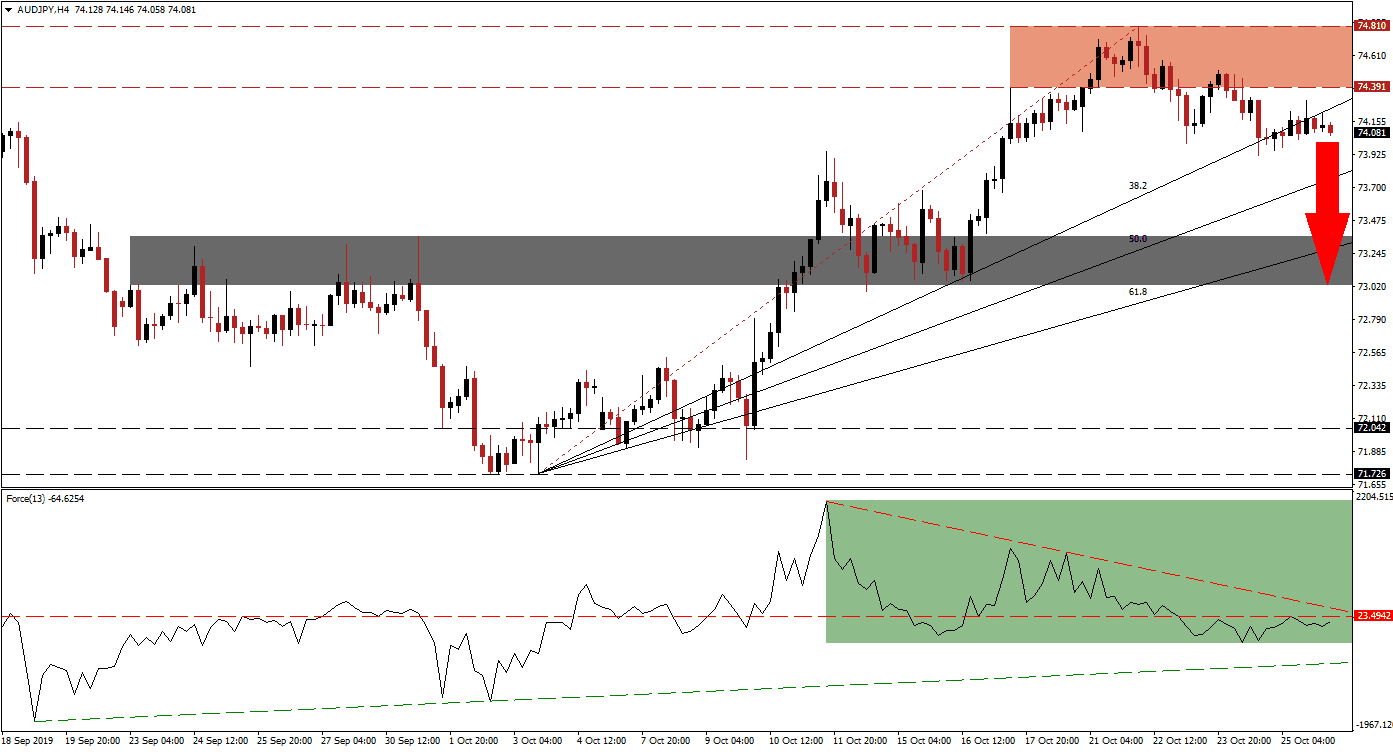
Despite the growing optimism that the US and China will resolve their trade war to a certain degree, allowing both countries to appear victorious without addressing the core issues, the economy is likely to slow down further and wont be able to avoid a recession. Chinese data released over the weekend showed industrial profits contracted for a second month in a row; this pressured the Australian Dollar, the top Chinese Yuan proxy currency to the downside at the same time the Japanese Yen, the top safe haven currency, advanced. The AUD/JPY descended from its resistance zone and completed a breakdown below its 38.2 Fibonacci Retracement Fan Support Level, turning it into resistance.
The Force Index, a next generation technical indicator, formed a negative divergence as price action moved into its resistance zone which resulted in the first warning that the advance is nearing its end. A negative divergence forms when an asset advances while the technical indicator contracts and represents a bearish trading signal. The Force Index then pushed below its horizontal support level and turned it into resistance while its descending resistance level is applying further downside pressure as marked by the green rectangle. This technical indicator, already in negative territory, is expected to descend further and a breakdown below its ascending support level to lead the AUD/JPY to the downside. You can learn more about the Force Index here.
Following the breakdown by this currency pair below its resistance zone, located between 74.391 and 74.810 as marked by the red rectangle, bearish momentum started to rise. The close proximity of the 38.2 Fibonacci Retracement Fan Support Level to the resistance zone resulted in a second breakdown which further increased bearish pressures on price action. Forex traders should now monitor the intra-day high of 73.948, this level marks the peak of a previous breakout above its short-term resistance zone which turned it into support following a reversal. A move below this mark is likely to attract the next wave of sell orders in the AUD/JPY.
As more economic data is likely to disappoint this week, together with the uncertainty about Brexit, forex traders are expected to seek more safe haven assets such as the Japanese Yen. This should allow the AUD/JPY to initiate a breakdown sequence which will take it through its entire Fibonacci Retracement Fan and down into its short-term support zone. This zone is located between 73.028 and 73.365 as marked by the grey rectangle and the 61.8 Fibonacci Retracement Fan Support Level is currently passing through it. A breakdown below the short-term support zone cannot be ruled out; you can learn more about a breakdown here.
AUD/JPY Technical Trading Set-Up - Breakdown Extension Scenario
Short Entry @ 74.100
Take Profit @ 73.050
Stop Loss @ 74.450
Downside Potential: 105 pips
Upside Risk: 35 pips
Risk/Reward Ratio: 3.00
Should the Force Index recover and complete a double breakout, above its horizontal and descending resistance levels, the AUD/JPY may move back into its resistance zone. While a sustained breakout is unlikely given the current fundamental picture, a short-term catalyst may emergence and force a move into its next resistance zone. This zone is located between 75.169 and 75.574 and should be considered a solid long-term short selling opportunity.
AUD/JPY Technical Trading Set-Up - Limited Breakout Scenario
Long Entry @ 74.650
Take Profit @ 75.350
Stop Loss @ 74.350
Upside Potential: 70 pips
Downside Risk: 30 pips
Risk/Reward Ratio: 2.33

