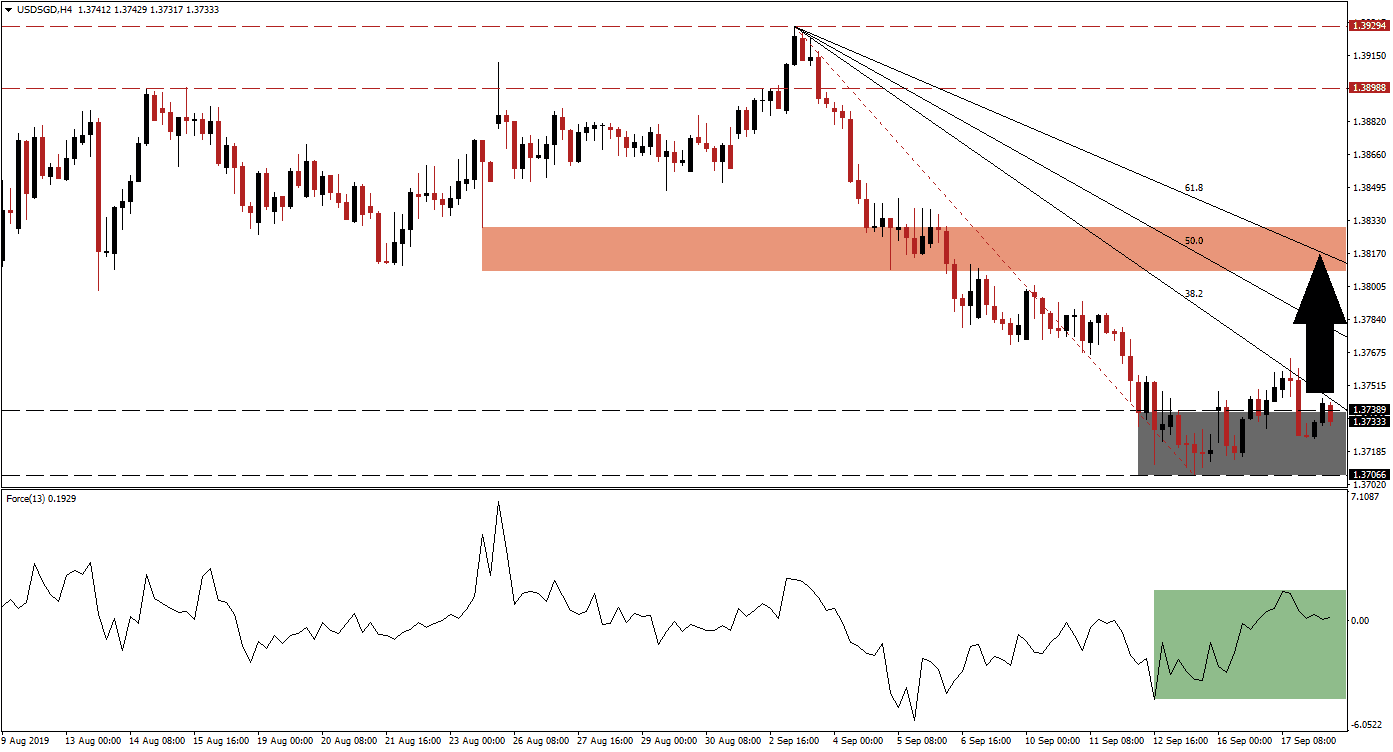
The US Federal Reserve will announce its interest rate decision today and markets expect a 25 basis point interest rate cut to a range between 1.75% and 2.00%. What will US Fed Chief Powell hint in regards to future monetary policy? Despite the dovish central bank which started to ease monetary policy, the US Dollar has been resilient as forex traders started to view it as a safe haven in a slowing global economy. This didn’t stop the USD/SGD from entering a strong sell-off which took price action into its support zone. A pause followed, allowing the 38.2 Fibonacci Retracement Fan Resistance Level to catch up.
What is the Fibonacci Retracement Fan?
The Fibonacci Retracement Fan is a different visualization of the Fibonacci retracement sequence which outlines important support and resistance levels in technical analysis. Those levels warrant a closer look and offer entry and exit levels for trades together with other aspects of the analysis.
The Force Index, a next generation technical indicator, started to advance after the USD/SGD reached its support zone. Following the brief spike in price action which took this currency pair above support and into its 38.2 Fibonacci Retracement Fan Resistance Level, a move which was quickly reversed, the Force Index pushed above the 0 center line and placed bulls in control; this is marked by the green rectangle. As bullish momentum is on the rise, and if the Force Index can maintain its uptrend, a double breakout may follow.
What is the Force Index?
The force index is considered a next generation technical indicator. As the name suggests, it measures the force behind a move. In other words, forex traders will get a better idea behind the strength of bullish or bearish pressures which are driving price action. The indicator consist of three components (directional change of the price, the degree of the change and the trading volume). This creates an oscillator which in conjunction with other aspects of technical analysis provides a good indicator for potential changes in the direction of price action. It subtracts the previous day closing price from today’s closing price and multiplies it by the volume. Strong moves are supported by volume and create the most accurate trading signals.
Price action is currently trading in-and-out of its support zone, located between 1.37066 and 1.37389 and marked by the grey rectangle. The 38.2 Fibonacci Retracement Fan Resistance Level has started to intersect this zone and with the rise in the Force Index, a double breakout is likely to materialize. The Singapore Dollar received a boost from Hong Kong capital outflow as a result of the protests which resulted in capital inflow to Singapore. This impact is now losing relevance and profit taking in the Singapore Dollar could further add bullish momentum to the USD/SGD and support a double breakout.
What is a Breakout?
A breakout occurs if price action moves above a support or resistance zone. A breakout above a support zone could signal a short-term move, such as a short-covering rally which occurs when forex traders exit short positions and realize trading profits, or a long-term move such as the start of a trend reversal from bearish to bullish. A breakout above a resistance zone signals strong bullish momentum and an extension of the existing uptrend.
The intra-day high of 1.37647 will be the next key level to watch out for together with the Force Index. This level marked the last price spike in the USD/SGD and a sustained move above it will open the path for more gains. With a dovish US central bank, the long-term downtrend in this currency pair is expected to remain intact. The expected double breakout should be of temporary nature and would suggests a healthy bearish trend. The next resistance zone is located between 1.38090 and 1.38299, marked by the red rectangle, and the likely upper limit of any advance. The 61.8 Fibonacci Retracement Fan Resistance Level is currently moving through this resistance zone.
What is a Resistance Zone?
A resistance zone is a price range where bullish momentum is receding and bearish momentum is advancing. They can identify areas where price action has a chance to reverse to the downside and a resistance zone offers a more reliable technical snapshot than a single price point such as an intra-day high.
USD/SGD Technical Trading Set-Up - Breakout Scenario
Long Entry @ 1.37350
Take Profit @ 1.38250
Stop Loss @ 1.37000
Upside Potential: 90 pips
Downside Risk: 35 pips
Risk/Reward Ratio: 2.27
The US central bank could surprise markets today by announcing a 50 basis point interest rate cut or suggest that more aggressive cuts will be needed in the future. This is expected to result in heavy selling in the US Dollar and a breakdown in the USD/SGD. While no interest rate cut today is an option, it is unlikely as US Fed Chief Powell is under pressure to deliver something. The expected 25 basis point interest rate cut could temporarily lift the US Dollar if Powell sounds an overall positive tone during the press conference. The technical picture favors a short-term advance in price action. Any negative surprise is expected to pressure the USD/SGD into a breakdown below its support zone.
What is a Breakdown?
A breakdown is the opposite of a breakout and occurs when price action moves below a support or resistance zone. A breakdown below a resistance zone could suggest a short-term move such as profit taking by forex traders or a long-term move such as a trend reversal from bullish to bearish. A breakdown below a support zone indicates a strong bearish trend and the extension of the downtrend.
USD/SGD Technical Trading Set-Up - Breakdown Scenario
Short Entry @ 1.36900
Take Profit @ 1.36200
Stop Loss @ 1.37250
Downside Potential: 70 pips
Upside Risk: 35 pips
Risk/Reward Ratio: 2.00

