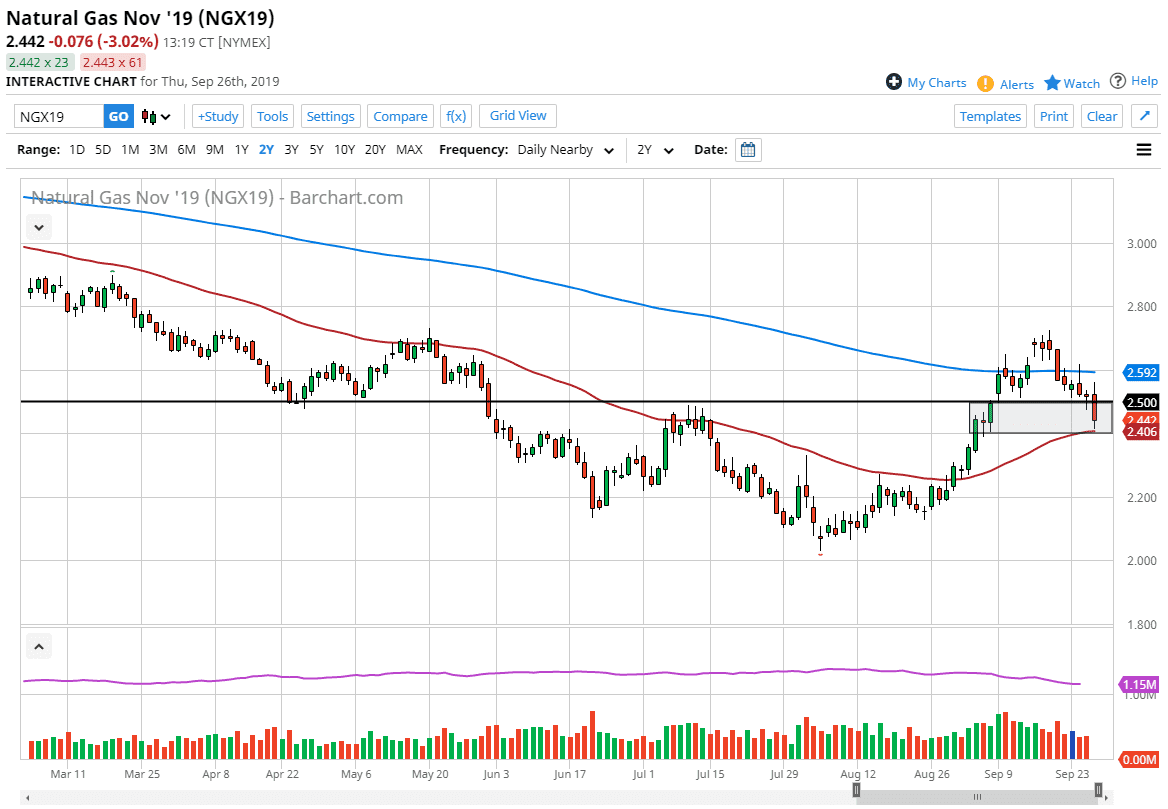
Natural gas markets initially tried to rally during the trading session on Thursday but broke down rather significantly after a larger than expected inventory number out of the United States. Obviously that’s a very bearish because it suggests that demand for natural gas is not picking up quite yet. That being the case though, I believe this is a short-term pullback simply because the time of the year dictates that natural gas should go higher. Beyond that, we also have seen technical support hold quite steadily, so at this point in time I think that this might be a nice buying opportunity for natural gas traders.
Looking at the chart, the 50 day EMA has held, which sits right at the $2.40 level and therefore it’s likely that value hunters will come back into pick up this market as we are trading the November contract. The November contract is obviously one that features a cold month, so it suggests that the demand for natural gas should pick up at this point. Because of this, we should start to see inventories get drawn down rather soon, and traders will start to try to get in front of that, anticipating the colder temperatures in the northern hemisphere.
That being said, even if we did break down below the 50 day EMA it’s likely that the market would probably go looking towards the $2.25 level underneath for a bit of a “reset”, as it is a large, round, psychologically significant figure and of course an area where we have seen the lot of action previously. Ultimately, this is a market that should continue to see a lot of volatility but eventually we should turn around as we have recently formed a bit of a bullish flag, and for that matter could be forming an even bigger one currently. If the market turns back around and break above the $2.50 level, then the market will attack the 200 day EMA above, and then eventually go towards the $3.00 level which is what the flak would suggest. Longer-term, I anticipate that this market will probably try to reach towards the $3.50 level towards Christmas or New Year’s Day. What’s interesting is that shortly after New Year’s Day, we start to see the market role right back over and plummet under normal circumstances. This is the beginning of the cyclical season for natural gas.

