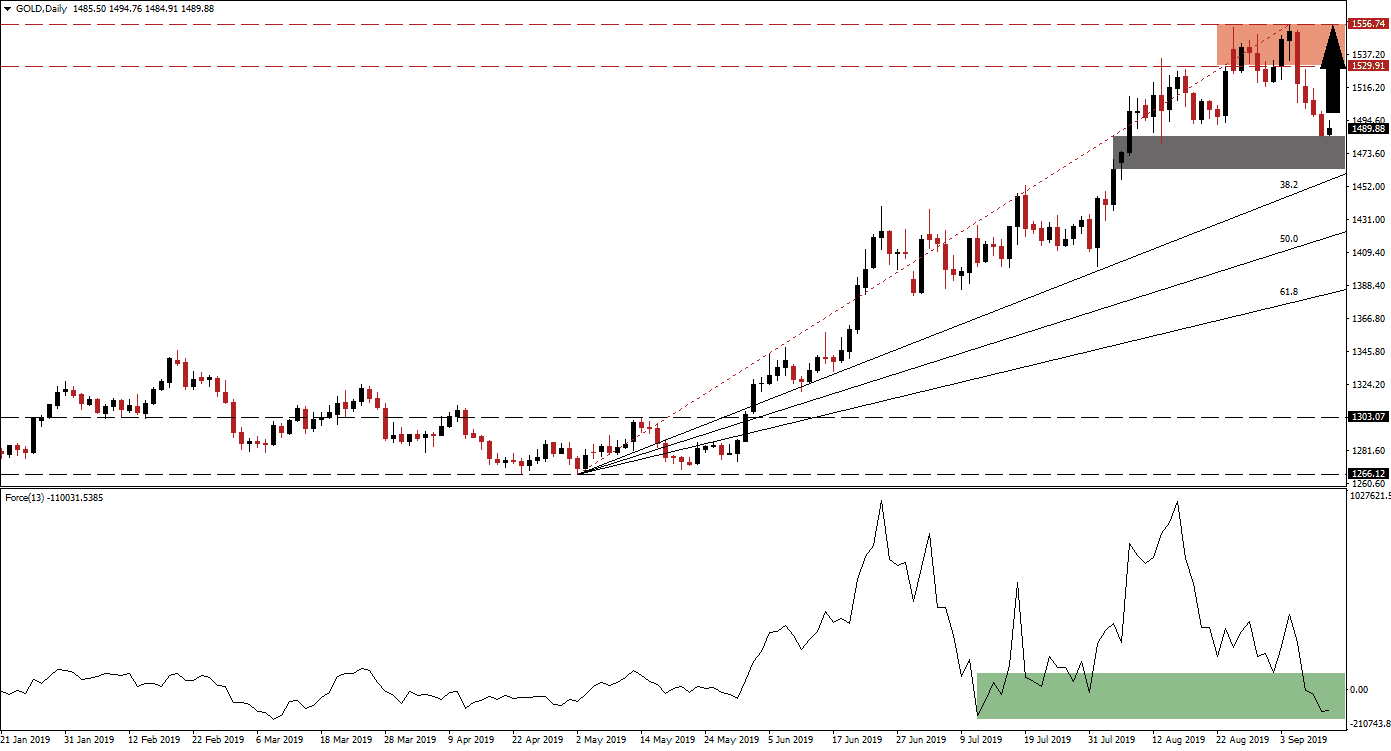
Gold came under selling pressure after reaching a multi-year intra-day high of 1,556.74 which is marked by the red rectangle in the chart. The ongoing trade war between the US and China has contributed to the sharp rally and the announcement by both parties that trade talks would resume in October initiated the sell-off. This was largely based on profit taking, but it did result in a breakdown below its resistance zone. The sharp advance in gold has resulted in a gap between price action and its Fibonacci Retracement Fan which started to close. Bearish momentum drove Gold below the $1,500 level which is more of a psychological level than meaningful support.
What is the Fibonacci Retracement Fan?
The Fibonacci Retracement Fan is a different visualization of the Fibonacci retracement sequence which outlines important support and resistance levels in technical analysis. Those levels warrant a closer look and offer entry and exit levels for trades together with other aspects of the analysis.
The Force Index, a next generation technical indicator, confirmed the breakdown and sell-off by entering a sharp contraction of its own. Prior to the breakdown the Force Index failed to record a new high as price action in gold advanced. While this didn’t automatically result in a bearish trading signal, it suggested that a pause in the rally is imminent and that a short-term sell-off on the back of profit taking should be expected. Gold started to stabilize as it is trading below the $1,500 mark and its 38.2 Fibonacci Retracement Fan Support Level. A sideways trend with a bearish bias may follow and give the Fibonacci Retracement Fan time to catch up to price action, the overall bullish uptrend remains healthy and intact.
What is the Force Index?
The force index is considered a next generation technical indicator. As the name suggests, it measures the force behind a move. In other words, forex traders will get a better idea behind the strength of bullish or bearish pressures which are driving price action. The indicator consist of three components (directional change of the price, the degree of the change and the trading volume). This creates an oscillator which in conjunction with other aspects of technical analysis provides a good indicator for potential changes in the direction of price action. It subtracts the previous day closing price from today’s closing price and multiplies it by the volume. Strong moves are supported by volume and create the most accurate trading signals.
Bearish momentum is fading and the Force Index has stabilized from its sharp reversal, but not until it contracted below the 0 center line. Bears remain in control of price action which is expected to remain in place short-term. As bearish momentum is being depleted while price action is stabilizing, a retracement of the sell-off is likely to follow. Central bank gold buying is further supporting a higher price moving forward and and any further contraction from current levels down to the 38.2 Fibonacci Retracement Fan Support Level should be viewed as a solid buying opportunity with the top range of its resistance zone at $1,556.74 as the next target.
What is a Resistance Zone?
A resistance zone is a price range where bullish momentum is receding and bearish momentum is advancing. They can identify areas where price action has a chance to reverse to the downside and a resistance zone offers a more reliable technical snapshot than a single price point such as an intra-day high.
Gold is expected to carve out a short-term support zone located between its 38.2 Fibonacci Retracement Fan Support Level and the $1,484.40 level which represents the intra-day low of its last bearish candlestick. This is marked by the grey rectangle, but the support zone will narrow over time until it will vanish completely. Price action is expected to end its current sell-off inside of this support zone. A bullish crossover in the Force Index above 0 as well as global economic and geopolitical events are expected to combine and result in a new rally for gold, supported by central bank buying as monetary policy will see further easing in the developed world.
What is a Support Zone?
A support zone is a price range where bearish momentum is receding and bullish momentum is advancing. They can identify areas where price action has a chance to reverse to the upside and a support zone offers a more reliable technical snapshot than a single price point such as an intra-day low.
Gold Technical Trading Set-Up - Price Action Recovery
Long Entry @ 1,490.00
Take Profit @ 1,556.70
Stop Loss @ 1,463.45
Upside Potential: 6,670 pips
Downside Risk: 2,655 pips
Risk/Reward Ratio: 2.51
A potential breakdown below the 38.2 Fibonacci Retracement Fan Support Level would open the path down to an extension of the correction with the 50.0 Fibonacci Retracement Fan Support Level as the next support level. This would need to be confirmed by new lows in the Force Index which at present remains an unlikely development. The 61.8 Fibonacci Retracement Fan Support Level remains key in order to keep the uptrend intact which is the expected long-term scenario. Any short-term entry as a result of a confirmed breakdown should be viewed as a short-term event within the long-term uptrend in gold.
What is a Breakdown?
A breakdown is the opposite of a breakout and occurs when price action moves below a support or resistance zone. A breakdown below a resistance zone could suggest a short-term move such as profit taking by forex traders or a long-term move such as a trend reversal from bullish to bearish. A breakdown below a support zone indicates a strong bearish trend and the extension of the downtrend.
Gold Technical Trading Set-Up - Breakdown Scenario
Short Entry @ 1,456.00
Take Profit @ 1,439.00
Stop Loss @ 1,463.45
Downside Potential: 1,700 pips
Upside Risk: 745 pips
Risk/Reward Ratio: 2.28

