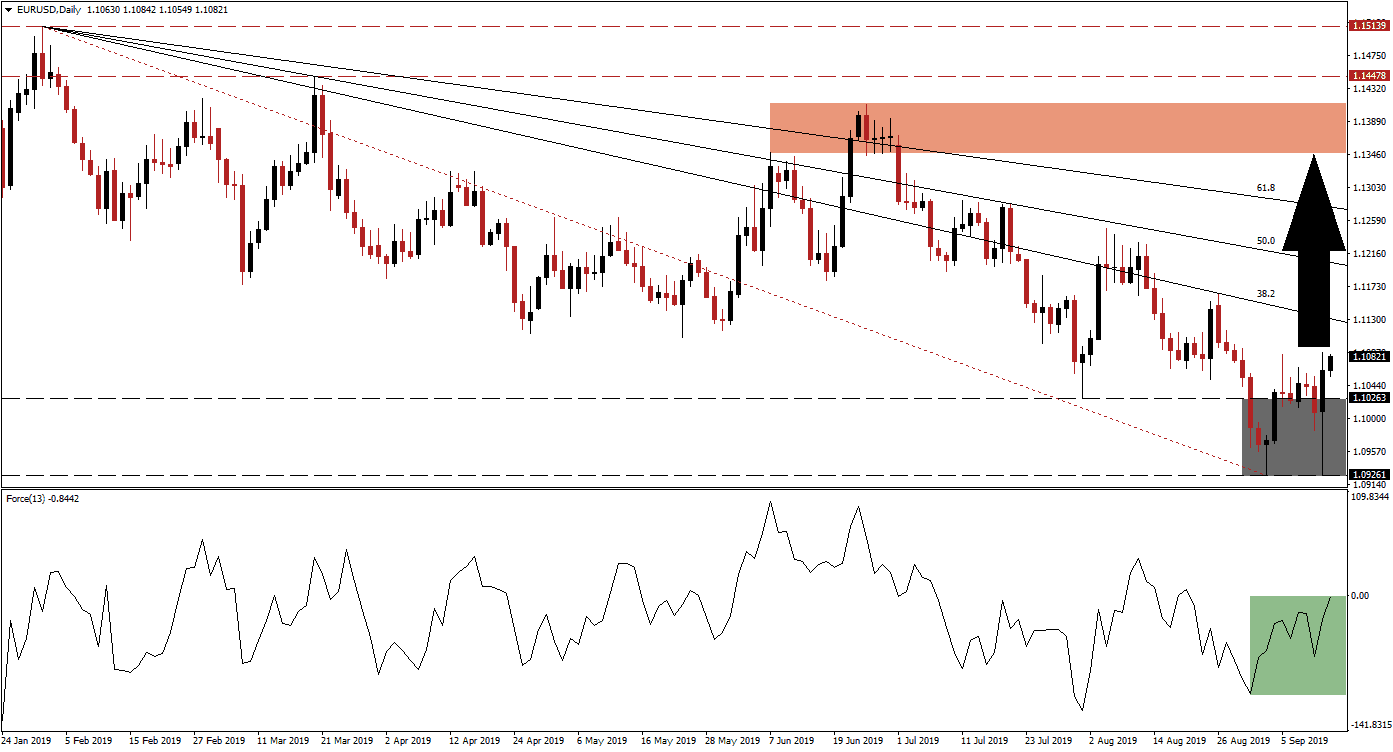
The ECB delivered a 10 basis point interest rate cut in its deposit facility rate to -0.50% and announced the restart of its QE program starting November 1st 2019 at a pace of €20 billion per month, open ended. It has also reduced borrowing costs on long-term loans by 10 basis points in order to assist the Eurozone banking sector. While the Euro initially sold off after the announcement, it made a quick reversal. This resulted in a breakout in the EUR/USD above its support zone, marked by the grey rectangle, which is located between 1.09261 and 1.10263. The 38.2 Fibonacci Retracement Fan Resistance Level will now dictate terms of price action moving forward.
What is the Fibonacci Retracement Fan?
The Fibonacci Retracement Fan is a different visualization of the Fibonacci retracement sequence which outlines important support and resistance levels in technical analysis. Those levels warrant a closer look and offer entry and exit levels for trades together with other aspects of the analysis.
The Force Index, a next generation technical indicator, started to accelerate higher as the breakout materialized, marked by the green rectangle. Preceding the breakout was the formation of a positive divergence which occurred after price action recorded the intra-day low of 1.10263 from where the EUR/USD accelerated to the upside and briefly pushed into its 50.0 Fibonacci Retracement Fan Resistance Level before correcting to a lower low at 1.09261. At the same time the Force Index started to advance, resulting in a positive divergence which represents a bullish trading signal.
What is the Force Index?
The force index is considered a next generation technical indicator. As the name suggests, it measures the force behind a move. In other words, forex traders will get a better idea behind the strength of bullish or bearish pressures which are driving price action. The indicator consist of three components (directional change of the price, the degree of the change and the trading volume). This creates an oscillator which in conjunction with other aspects of technical analysis provides a good indicator for potential changes in the direction of price action. It subtracts the previous day closing price from today’s closing price and multiplies it by the volume. Strong moves are supported by volume and create the most accurate trading signals.
Yesterday’s breakout extended today and is now expected to result into a breakout above its 38.2 Fibonacci Retracement Fan Resistance Level, turning it into support. With the US Federal Reserve poised to cut interest rates next week, more upside in the EUR/USD is anticipated as bullish momentum is expanding. The Force Index is closing in on the center line and a successful move above 0 is likely to result into new net buy orders in this currency pair which will provide the necessary force for another breakout.
What is a Breakout?
A breakout occurs if price action moves above a support or resistance zone. A breakout above a support zone could signal a short-term move, such as a short-covering rally which occurs when forex traders exit short positions and realize trading profits, or a long-term move such as the start of a trend reversal from bearish to bullish. A breakout above a resistance zone signals strong bullish momentum and an extension of the existing uptrend.
As long as the upward momentum in the Force Index remains and if this technical indicator confirms the anticipated breakout above the 38.2 Fibonacci Retracement Fan Resistance Level, the uptrend is expected to last. This will result in a stronger rally in the EUR/USD which can take it above the 50.0 Fibonacci Retracement Fan Resistance Level as well as above the 61.8 Fibonacci Retracement Fan Resistance Level and into its next resistance zone. This zone is located between 1.13489 and 1.14113, marked by the red rectangle, and price action has plenty of upside potential with limited downside risk.
What is a Resistance Zone?
A resistance zone is a price range where bullish momentum is receding and bearish momentum is advancing. They can identify areas where price action has a chance to reverse to the downside and a resistance zone offers a more reliable technical snapshot than a single price point such as an intra-day high.
EUR/USD Technical Trading Set-Up - Breakout Scenario
Long Entry @ 1.10750
Take Profit @ 1.13750
Stop Loss @ 1.10000
Upside Potential: 300 pips
Downside Risk: 75 pips
Risk/Reward Ratio: 4.00
Any potential reversal to the downside appears to be limited to the bottom range of its support zone at 1.09261. Lackluster economic growth out of the Eurozone is already priced into market and the risk now remains to the upside. A failure by the Force Index to confirm the next breakout could lead to a short-term sell-off from where a renewed push to the upside should be expected. Mounting negative pressures on the US Dollar from a fundamental perspective further limit downside potential in the EUR/USD. Any drop into its support zone should be viewed as a buying opportunity.
What is a Support Zone?
A support zone is a price range where bearish momentum is receding and bullish momentum is advancing. They can identify areas where price action has a chance to reverse to the upside and a support zone offers a more reliable technical snapshot than a single price point such as an intra-day low.
EUR/USD Technical Trading Set-Up - Reversal Scenario
Short Entry @ 1.09900
Take Profit @ 1.09300
Stop Loss @ 1.10200
Downside Potential: 60 pips
Upside Risk: 30 pips
Risk/Reward Ratio: 2.00

