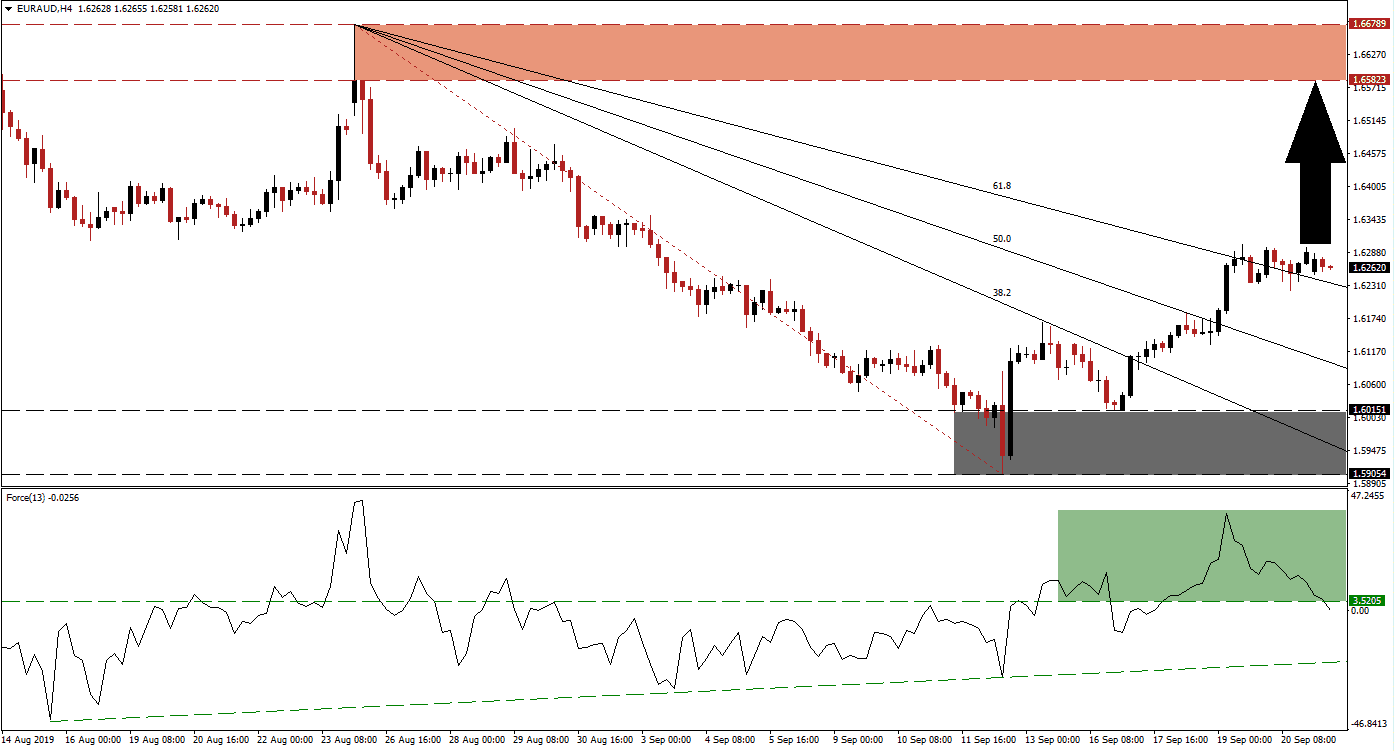
Forex traders grew more bullish on the Euro after the ECB cuts its deposit facility rate to -0.50% and announced the re-start of quantitative easing on November 1st 2019 at a rate of €20 billion per month. This allowed the EUR/AUD to launch a rally which took it out of its support zone and resulted in a complete breakout above the entire Fibonacci Retracement Fan sequence. The final push above its 61.8 Fibonacci Retracement Fan Resistance Level turned the sequence into support. Price action stalled now, which is a normal development after such a move and series of breakouts.
The Force Index, a next generation technical indicator, confirmed the breakout sequence. The first major breakout above its support zone, located between 1.59054 and 1.60151 which is marked by the grey rectangle, took the EUR/AUD into its 38.2 Fibonacci Retracement Fan Resistance Level. A move into the top range of its support zone resulted in the breakout above its 61.8 Fibonacci Retracement Fan Resistance Level and the Force Index recorded a higher. This is marked by the green rectangle. While this technical indicator started to descend below its horizontal support level, the long-term uptrend remains intact. You can learn more about the Fibonacci Retracement Fan, the Force Index and the Support Zone here.
The EUR/AUD may challenge its descending 61.8 Fibonacci Retracement Fan Support Level which can push the Force Index lower and into its ascending support level. As long as the uptrend remains intact, this currency pair can extend its breakout. The Australian Dollar, a Chinese Yuan proxy currency, is heavily exposed to the Chinese economy and developments in the trade war with the US. Australian PMI data released this morning came in mixed as the service sector exited contraction while the manufacturing sector entered it. The intra-day low of 1.62226 should be monitored which represents the current low of the breakout above the 61.8 Fibonacci Retracement Fan Level which turned it from resistance to support.
Should the uptrend remain intact and the 61.8 Fibonacci Retracement Fan Support Level hold while the the Force Index maintain its long-term bullish trend, the EUR/AUD can extend its breakout until it reaches its next resistance zone. This one is located between 1.65823 and 1.66789 which is marked by the red rectangle. Today’s PMI data out of the Eurozone could provide the catalysts to accelerate the move to the upside, economists anticipate a solid report which shows expansion across all three PMI reports. You can learn more about a Breakout, a Breakdown and the Resistance Zone here.
EUR/AUD Technical Trading Set-Up - Breakout Extension Scenario
Long Entry @ 1.62350
Take Profit @ 1.65800
Stop Loss @ 1.61450
Upside Potential: 345 pips
Downside Risk: 90 pips
Risk/Reward Ratio: 2.83
A breakdown below its descending 61.8 Fibonacci Retracement Fan Support Level and extension below its intra-day high of 1.61670, the high recorded following the breakout above its support zone, could lead to a correction in the EUR/AUD into the top range of its support zone. This would require a fundamental catalyst such as a disappointing PMI report out of the Eurozone.
EUR/AUD Technical Trading Set-Up - Breakdown Scenario
Short Entry @ 1.61450
Take Profit @ 1.60150
Stop Loss @ 1.62100
Downside Potential: 130 pips
Upside Risk: 65 pips
Risk/Reward Ratio: 2.00

