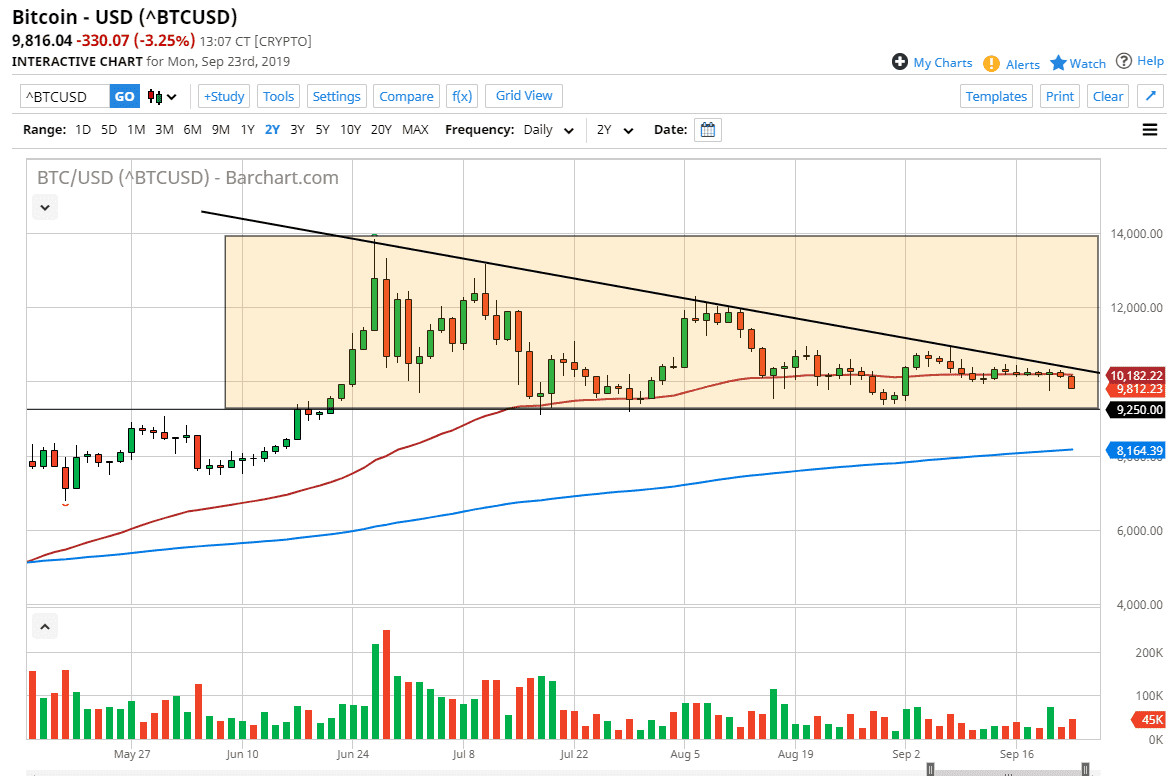
The Bitcoin market broke down significantly during the trading session on Monday, making yet another attempt to reach below the $9800 level. If you been following my articles here at Daily Forex, you know that I have recently started to pay close attention to the descending triangle that I have marked on the chart. Beyond that, something else that concerns me is that even with all of this central bank quantitative easing and interest rate cuts out there, bitcoin has seem to have stalled a period if the Federal Reserve is entering a dovish theme, then it’s very likely that bitcoin should be rising. However, it’s not and that could be the biggest thing to pay attention to.
The bitcoin market breaking below the $9250 level would kick off the move in this descending triangle, which could send it back towards the $5000 level. Alternately, if we can break above the downtrend line, then it’s likely that we could go to the $12,000 level, followed by the $14,000 level. That would be a simple return to the rectangle that the market had been in. However, one thing is for sure here: price action has not been encouraging over the last couple of weeks.
On a break down below the bottom of the descending triangle, it’s possible that the 200 day EMA, pictured in blue, could come in and offer a bit of support, but at this point it’s very unlikely that it will hold longer term. Another thing that’s important to pay attention to is the fact that the daily candle stick is closing towards the bottom, and that of course is a sign that we could very easily break down. It suggests that there should be some follow-through.
The fact that bitcoin has gone quiet in the environment that we find ourselves in, does cause me concern. The Gold markets have rallied quite nicely, right along with silver. The bitcoin market certainly has been lagging and that’s another big red flag that I see. At this point, pay attention to the triangle as it should give us clues as to where we go next. It may take a couple of days to make a decision, but once it does it could lead to a relatively sizable move and new intermediate trend in this market. All things being equal, little bit of patience could lead to bigger profits.

