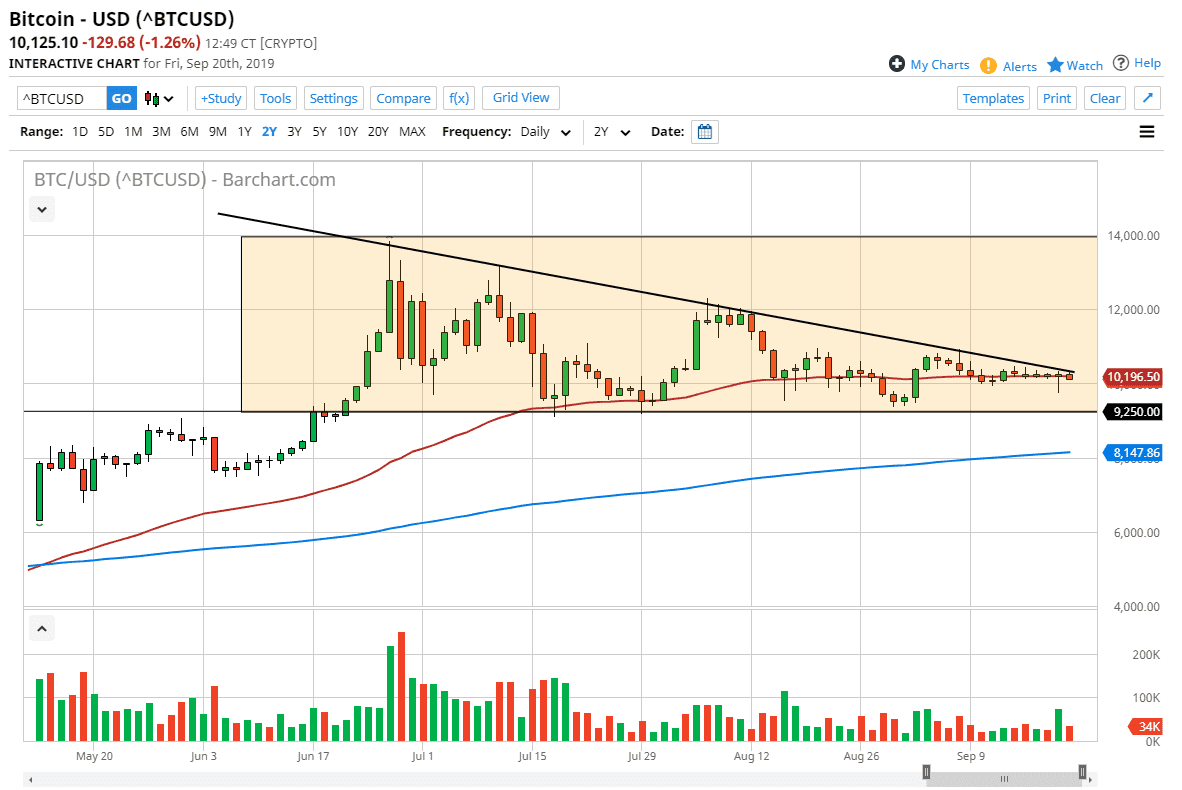
Bitcoin markets fell during the trading session on Friday, as we continue to see a bit of weakness creep into this market. Now that we are testing a major downtrend line from the descending triangle, it’s very precipitous at this point. At this point, the 50 day EMA is sideways, and now that we are testing this triangle, we become a bit closer to the time where we are going to have to make some type of decision.
Looking at this chart, we could get an answer on Monday, but there are several different things that I am watching at the same time. The fact that the moving averages on the chart that I follow are going somewhat sideways, the reality is that the market is somewhat benign. This is a market that has died off, and for some time look like it was trying to consolidate the massive gains that it had enjoyed previously. However, as the highs continue to drift lower, that’s a very ominous signal.
Looking at the rectangle, the $9250 level underneath should be massive support. If we break down through that trend line, which is not only the bottom of the rectangle but the bottom of the potential descending triangle, the implied move is down to just below the $5000 level. If that happens, it’s very likely that the uptrend is over. The market may have gotten ahead of itself but until these types of moves stopped, it is going to be a secondary and relatively thin market to say the least.
However, if we break above the downtrend line then we simply go back to consolidation. The $12,000 level above would be the initial target, followed by the $14,000 level as it is the top of the overall implied descending triangle/rectangle. What does concern me about this market lately though is the fact that central banks around the world continue to cut rates and do what they can to destroy fiat currency. Concurrently, Bitcoin has done absolutely nothing. Remember, that’s the main appeal for most Bitcoin traders, the fact that they are not under the thumb of central banks. In that scenario, Bitcoin should be shooting higher against such currencies as the US dollar, Japanese yen, etc. If it can’t rally in this scenario, that’s certainly is something to pay attention to. Sometimes it’s about what a market will do rather than what it does.

