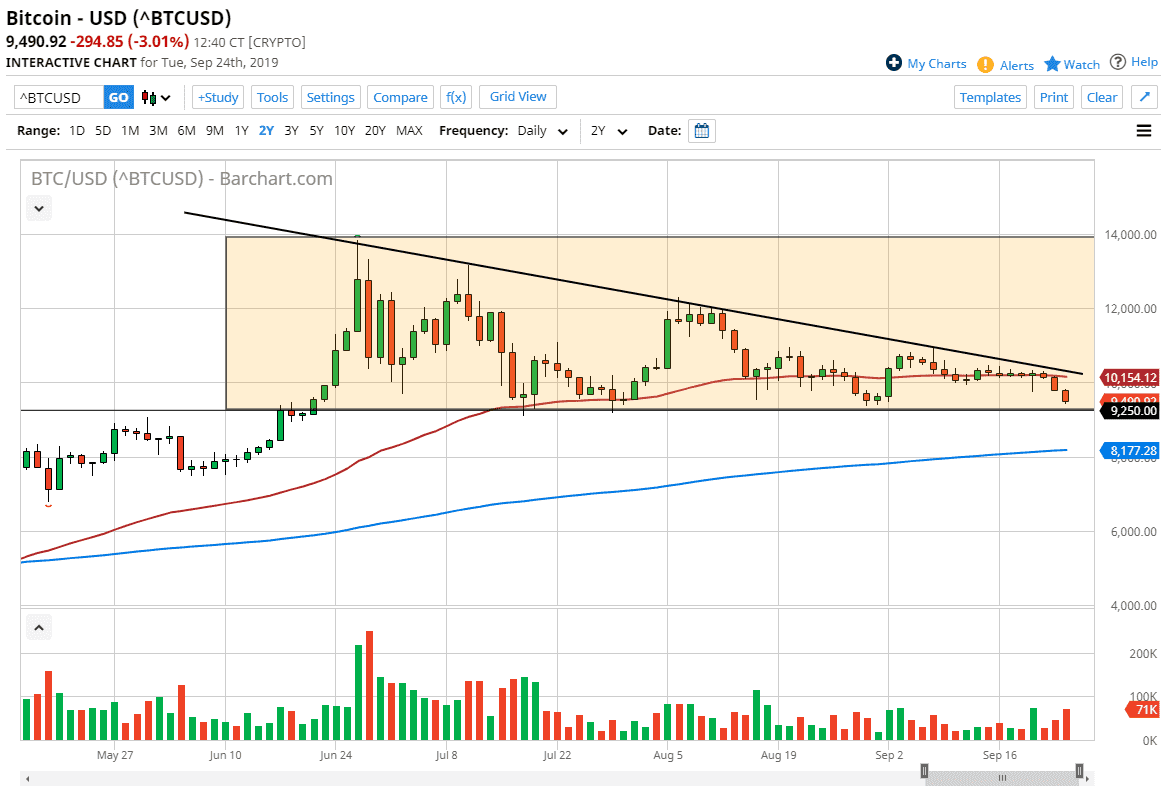
Bitcoin markets broke down a bit during the trading session on Tuesday, for the third day in a row. Bitcoin suddenly looks as if it is in a bit of trouble, because there is a lot of quantitative easing and rate cuts out there currently. With the central banks working against the value of fiat currency, you would expect Bitcoin to take off to the upside. However, Bitcoin has done the exact opposite and this is a very negative sign indeed. For quite some time, Bitcoin and gold followed each other but that correlation has broken apart.
The Bitcoin market has been forming a larger pattern or two, including a rectangle, but more importantly a descending triangle. Because of this, there is a certain amount of noise and confusion at the moment, and there are a couple of different possibilities showing up on the chart. The easiest one to pay attention to is the rectangle, as you can see drawn on the chart. However, we are looking at the descending triangle being the more likely of the two scenarios, as we are starting to break down a bit. With the fundamental situation and the three negative days in a row, it seems more likely that the sellers are going to take over.
If we do break down below the $9250 level which I see as the bottom of the descending triangle, we could drop below the $5000 level. That would of course be a very negative sign and it seems as if a daily close below the $9250 level would send off alarm bells. Although the 200 day EMA is currently near the $8200 level, it’s very likely that we continue to break down and go lower.
The alternate scenario of course is that we break above the downtrend line from the descending triangle. If that happens, it’s very likely that the market could go reaching towards the $12,000 level, which was resistance, but more often than not you reach towards the top of the descending triangle or in this case the rectangle, both of which would be at the $14,000 level. The market has been very choppy and negative over the last couple of months though, at least in a very slow descent. Because of this, it’s another reason to think that it’s possible the sellers are going to take over eventually. However, I need to see a daily close on one side of the triangle or the other to put money to work.

