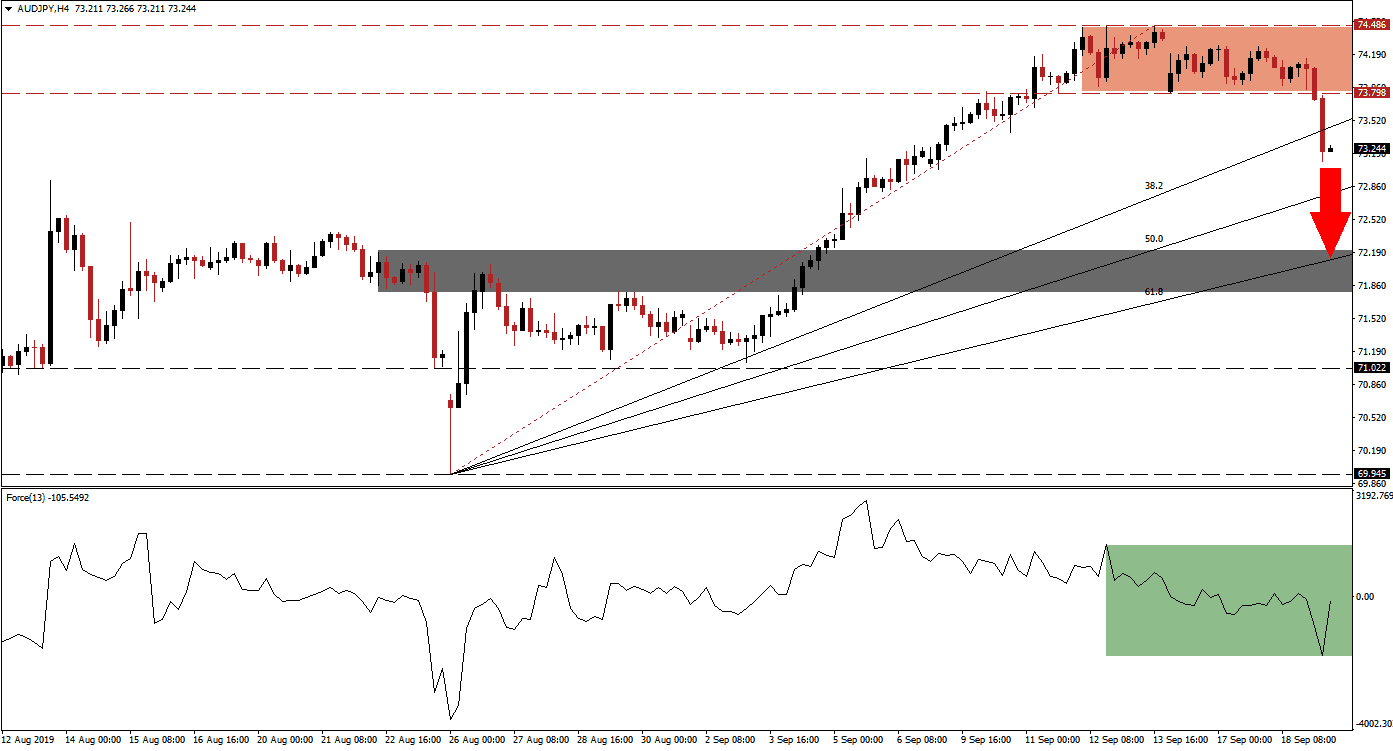
After the Bank of Japan decided to leave interest rates unchanged at -0.10%, the Japanese Yen entered a relieve rally. Expectations have called for more monetary easing as early as this month, but the Japanese central bank decided to wait. This resulted in a breakdown in the AUD/JPY below its resistance zone as well as below its 38.2 Fibonacci Retracement Fan Support Level, turning it into resistance. The double breakdown has further increase bearish momentum in this currency pair as forex traders adjust their positions. The Bank of Japan has pointed out that it won’t allow the Japanese Yen, a safe haven currency, strengthen to the point that it would hurt the Japanese economy. The next major support level is now the 61.8 Fibonacci Retracement Fan Support Level.
What is the Fibonacci Retracement Fan?
The Fibonacci Retracement Fan is a different visualization of the Fibonacci retracement sequence which outlines important support and resistance levels in technical analysis. Those levels warrant a closer look and offer entry and exit levels for trades together with other aspects of the analysis.
The Force Index, a next generation technical indicator, has indicated that the bullish trend in the AUD/JPY is nearing the end. Initially a negative divergence formed as price action moved into its resistance zone. A negative divergence occurs when an asset advances and makes new highs while the underlying technical indicator contract. The peak in the Force Index when the AUD/JPY recorded its intra-day high of 74.486 was well below its previous one and started to collapse below the 0 center line as the breakdown materialized; this is marked by the green rectangle. While this technical indicator recovered from its low, the downtrend remains intact.
What is the Force Index?
The force index is considered a next generation technical indicator. As the name suggests, it measures the force behind a move. In other words, forex traders will get a better idea behind the strength of bullish or bearish pressures which are driving price action. The indicator consist of three components (directional change of the price, the degree of the change and the trading volume). This creates an oscillator which in conjunction with other aspects of technical analysis provides a good indicator for potential changes in the direction of price action. It subtracts the previous day closing price from today’s closing price and multiplies it by the volume. Strong moves are supported by volume and create the most accurate trading signals.
Following the breakdown below its resistance zone, located between 73.798 and 74.486 which is marked by the red rectangle, the uptrend in the AUD/JPY has been violated. Given the extend of the bearish pressures, as confirmed by the Force Index, more downside should be expected. The rise in geopolitical tensions is further driving capital inflow into the Japanese Yen after forex traders were cautious do the the uncertainty of the Bank of Japan actions and weakness out of the Chinese economy is having a negative impact on the Australian Dollar. As a result, price action is clear to develop its current trend to the downside.
What is a Breakdown?
A breakdown is the opposite of a breakout and occurs when price action moves below a support or resistance zone. A breakdown below a resistance zone could suggest a short-term move such as profit taking by forex traders or a long-term move such as a trend reversal from bullish to bearish. A breakdown below a support zone indicates a strong bearish trend and the extension of the downtrend.
A move into its 50.0 Fibonacci Retracement Fan Support Level is expected to follow and if the Force Index can maintain its bearish stance, a breakdown into its 61.8 Fibonacci Retracement Fan Support Level may follow. This level is currently passing through its next, shallow support zone which is located between 71.799 and 72.193; marked by the grey rectangle. Further analysis would be required once the AUD/JPY reaches this level in order to assess if another breakdown is pending which can extend the sell-off.
What is a Support Zone?
A support zone is a price range where bearish momentum is receding and bullish momentum is advancing. They can identify areas where price action has a chance to reverse to the upside and a support zone offers a more reliable technical snapshot than a single price point such as an intra-day low.
AUD/JPY Technical Trading Set-Up - Breakdown Extension Scenario
Short Entry @ 73.300
Take Profit @ 72.250
Stop Loss @ 73.700
Downside Potential: 105 pips
Upside Risk: 40 pips
Risk/Reward Ratio: 2.63
Any potential price action reversal to the upside is expected to be limited to the top range of its current resistance zone; this is marked by its intra-day high of 74.486. Without a fundamental catalyst. A breakout above this level is unexpected as the technical picture favors an extension of the sell-off in the AUD/JPY. The Force Index should be closely monitored, a continuation of its downtrend should drive price action further to the downside. A sustained move above 0 with a breakout above its downtrend may push this currency pair back into its resistance zone from a fresh sell-off could emerge.
What is a Resistance Zone?
A resistance zone is a price range where bullish momentum is receding and bearish momentum is advancing. They can identify areas where price action has a chance to reverse to the downside and a resistance zone offers a more reliable technical snapshot than a single price point such as an intra-day high.
AUD/JPY Technical Trading Set-Up - Price Action Reversal Scenario
Long Entry @ 73.850
Take Profit @ 74.450
Stop Loss @ 73.550
Upside Potential: 60 pips
Downside Risk: 30 pips
Risk/Reward Ratio: 2.00

