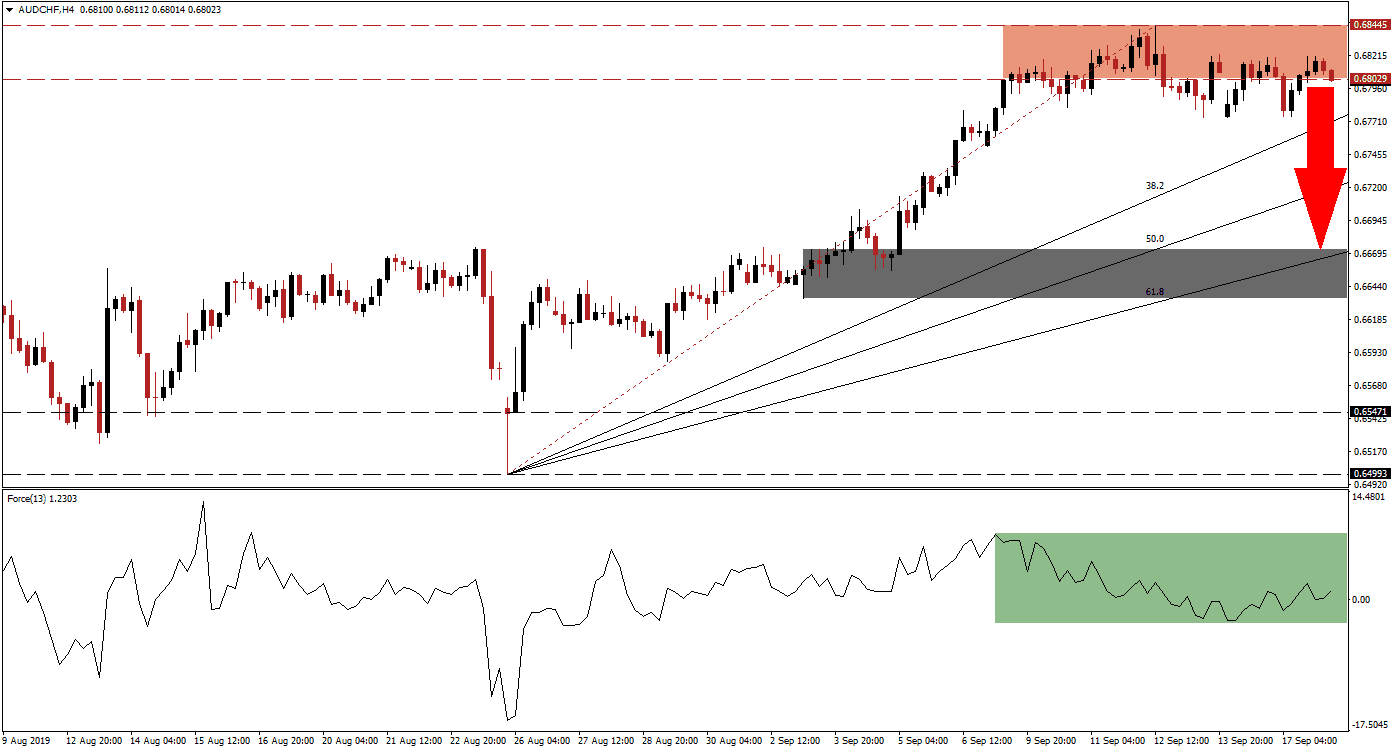
The strong rally in the AUD/CHF, which originated from its intra-day low of 0.64933, is now exhausted and a sideways trend started inside of its resistance zone. The overall advance was well supported by its Fibonacci Retracement Fan Support Sequence, throughout the rally this currency pair never touched or dipped below its 38.2 Fibonacci Retracement Fan Support Level. This created a gap and the current sideways trend allowed for a closure of it as the Fibonacci Retracement Fan Support Sequence is now approaching the resistance zone where the AUD/CHF is depleting bullish momentum.
What is the Fibonacci Retracement Fan?
The Fibonacci Retracement Fan is a different visualization of the Fibonacci retracement sequence which outlines important support and resistance levels in technical analysis. Those levels warrant a closer look and offer entry and exit levels for trades together with other aspects of the analysis.
The Force Index, a next generation technical indicator, offered an early warning that the uptrend is unlikely to continue as a negative divergence formed which is marked by the green rectangle. A negative divergence occurs when price action extends to the upside and records fresh highs while the underlying technical indicator starts to contract. As the AUD/CHF recorded its intra-day high of 0.68445, the Force Index dipped into negative territory. It has since drifted back above the 0 center line as price action remained confined to its resistance zone.
What is the Force Index?
The force index is considered a next generation technical indicator. As the name suggests, it measures the force behind a move. In other words, forex traders will get a better idea behind the strength of bullish or bearish pressures which are driving price action. The indicator consist of three components (directional change of the price, the degree of the change and the trading volume). This creates an oscillator which in conjunction with other aspects of technical analysis provides a good indicator for potential changes in the direction of price action. It subtracts the previous day closing price from today’s closing price and multiplies it by the volume. Strong moves are supported by volume and create the most accurate trading signals.
Bullish momentum is now fading inside the resistance zone which is located between 0.68029 and 0.68445, marked by the red rectangle, and a breakdown is expected to follow. Minutes released from the latest Reserve Bank of Australia meeting suggested that the central bank will ease monetary policy further in order to support its economy and achieve its inflation target. The slowdown in the Chinese economy is also clouding growth prospects for the Australian economy which adds additional downside pressures on the AUD/CHF for a breakdown below its resistance zone.
What is a Resistance Zone?
A resistance zone is a price range where bullish momentum is receding and bearish momentum is advancing. They can identify areas where price action has a chance to reverse to the downside and a resistance zone offers a more reliable technical snapshot than a single price point such as an intra-day high.
The Force Index should be closely monitored as it could provide more insight in regards to the timing of the expected breakdown. While it did move back above the 0 center line, it remains inside of its downtrend which started from its most recent peak. The close proximity of the 38.2 Fibonacci Retracement Fan Support Level to the resistance zone is likely to result in a double breakdown in the AUD/CHF and violate the uptrend. This would open the path for a correction down into its next support zone which is located between 0.66351 and 0.66727, marked by the grey rectangle. The 61.8 Fibonacci Retracement Fan Support Level is about to move above this support zone.
What is a Breakdown?
A breakdown is the opposite of a breakout and occurs when price action moves below a support or resistance zone. A breakdown below a resistance zone could suggest a short-term move such as profit taking by forex traders or a long-term move such as a trend reversal from bullish to bearish. A breakdown below a support zone indicates a strong bearish trend and the extension of the downtrend.
AUD/CHF Technical Trading Set-Up - Breakdown Scenario
Short Entry @ 0.68000
Take Profit @ 0.66750
Stop Loss @ 0.68500
Downside Potential: 125 pips
Upside Risk: 50 pips
Risk/Reward Ratio: 2.50
With global economic as well as political risk on the rise, the Swiss Franc is also expected to attract safe haven bids moving forward which further limits the breakout potential in the AUD/CHF. Any short-term breakout above its resistance zone would require a fundamental catalysts and is expected to be refined to its intra-day high of 0.69539 which forms the top range of its next resistance zone. Given the current fundamental picture as well as technical set-up, the breakout risk in this currency pair remains limited.
What is a Breakout?
A breakout occurs if price action moves above a support or resistance zone. A breakout above a support zone could signal a short-term move, such as a short-covering rally which occurs when forex traders exit short positions and realize trading profits, or a long-term move such as the start of a trend reversal from bearish to bullish. A breakout above a resistance zone signals strong bullish momentum and an extension of the existing uptrend.
AUD/CHF Technical Trading Set-Up - Limited Breakout Scenario
Long Entry @ 0.68550
Take Profit @ 0.69500
Stop Loss @ 0.68100
Upside Potential: 95 pips
Downside Risk: 45 pips
Risk/Reward Ratio: 2.11

