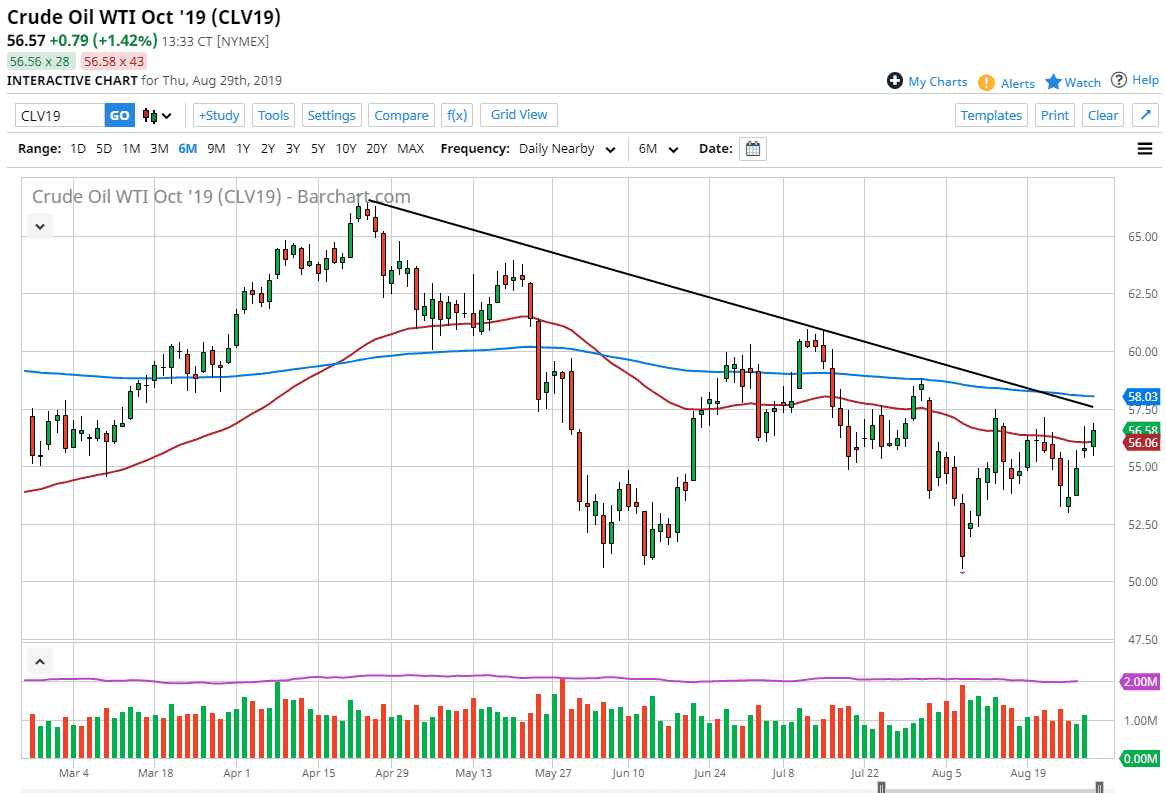
The West Texas Intermediate Crude Oil market rallied rather significantly during the trading session again on Thursday, pressing the top of the shooting star from the previous session. This of course is a very bullish sign, and I think a lot of this is hope sparked by the idea that the Chinese weren’t going to retaliate against the Americans as far as trade tariffs are concerned. That’s great and all, but at this point it doesn’t necessarily suggest that we are going to shoot straight up in the air. We have seen hope form in the US/China trade relations pop up occasionally, only to get squashed. At best, I suspect this is a route is to keep that under control while the Chinese deal with Hong Kong.
Looking at the chart, you can see that the downtrend line is just above at the $57.50 level, and although we are above the 50 day EMA, it’s very likely that the 200 day EMA could come into play rather soon as well. At this point, I think that signs of exhaustion may still be sold. However, the question then becomes whether or not we can continue to go higher for any real length of time. If we can break above the 200 day EMA, then obviously the trend will have changed again.
Looking at this chart, I will have to say it looks like we are going to make an attempt to break out to the upside but all things being equal I think there is still plenty of resistance above that the first signs of trouble will probably send this market right back down. The gap below still hasn’t been filled, which of course tends to be done rather rapidly. The $55 level underneath would be the target, at least as far as filling the gap is concerned. If we were to break down below the $55 level, then it’s likely that we go down to the $53 level.
I do think that we will continue to see a lot of volatility in this market, but that’s nothing new for crude oil. There is a serious lack of demand when it comes to the global economy, and that should eventually come into play. Having said that, I believe that you still have to worry about pullbacks that suddenly pick up quite a bit of momentum.

