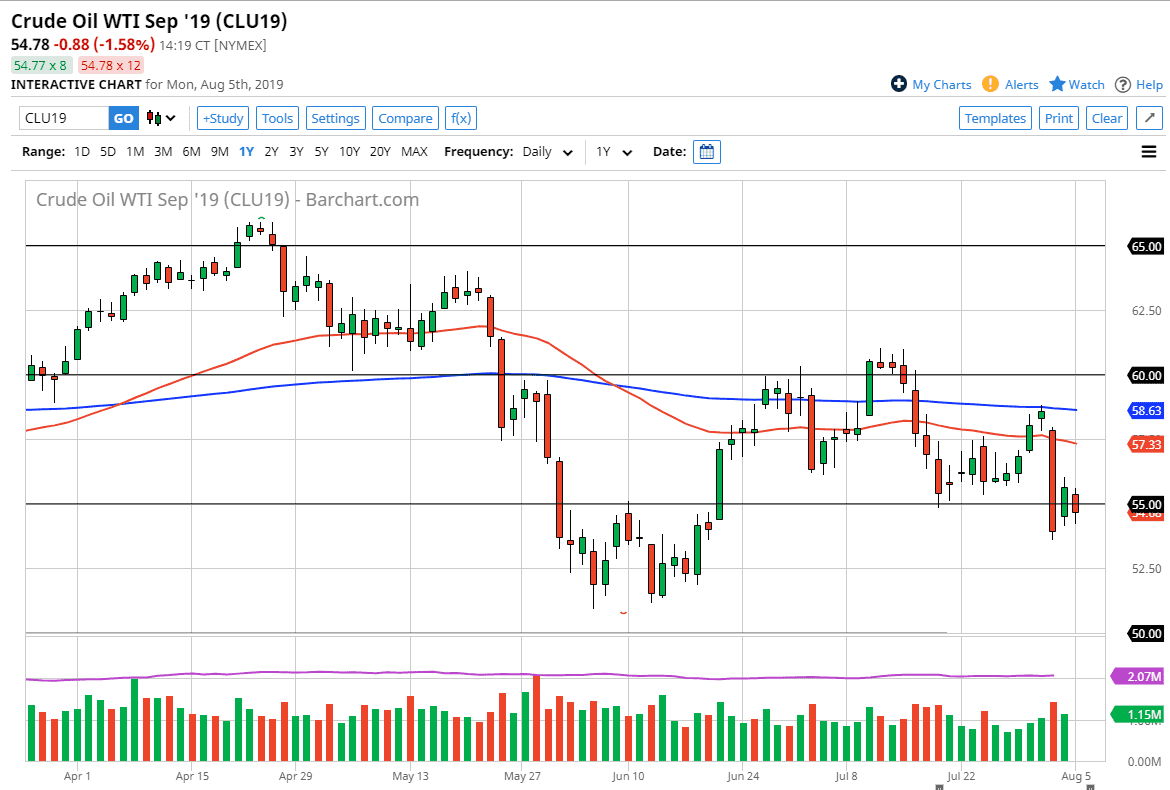
The WTI Crude Oil market continues to consolidate around a large, round, psychologically significant figure, as we are near the $55 handle. This is an area that should continue to attract a lot of attention, because the crude oil market tends to move in five dollar increments anyway. The candle stick for the day is rather benign, which shows us just how important this level continues to be.
Having said that, the candle stick from Thursday was horrifically bearish, telling us just how negative things are in this market. I think short-term rallies should be a nice selling opportunity, especially near the 50 day EMA which is the red indicator on the chart that is touching the top of that nasty candlestick. A break above the 50 day EMA is of course a very bullish sign but we also have the 200 day EMA just above it. At this point, this for the life of me looks like a market that has a couple of crucial EMA indicators going flat but looking very much like they are ready to roll over to the downside.
If we break down below the bearish candle from Thursday, then it opens up a move to the $51 level underneath which I think is the actual target. I recognize that there is a significant amount of support between the $50 level and the $51 level. That’s a huge “zone” underneath that should offer plenty of support so if we were to break down below the $50 handle, that would be an extraordinarily negative sign. That being said, I think that the market is attracted to that level and you can make an argument for the last four candlesticks forming a bit of a bearish pennant.
I have no interest in buying this market until we break above the 200 day EMA, but until then I think that any time we rally it should offer signs of exhaustion that you can take advantage of. The global growth situation is a very negative, and therefore that doesn’t help the idea of demand for crude oil. If the bickering between the Iranians and the US can’t lift oil prices for more than a few moments, that shows just how bearish this market truly is. I think at this point it’s very likely that we continue to see sellers come in every time they can.

