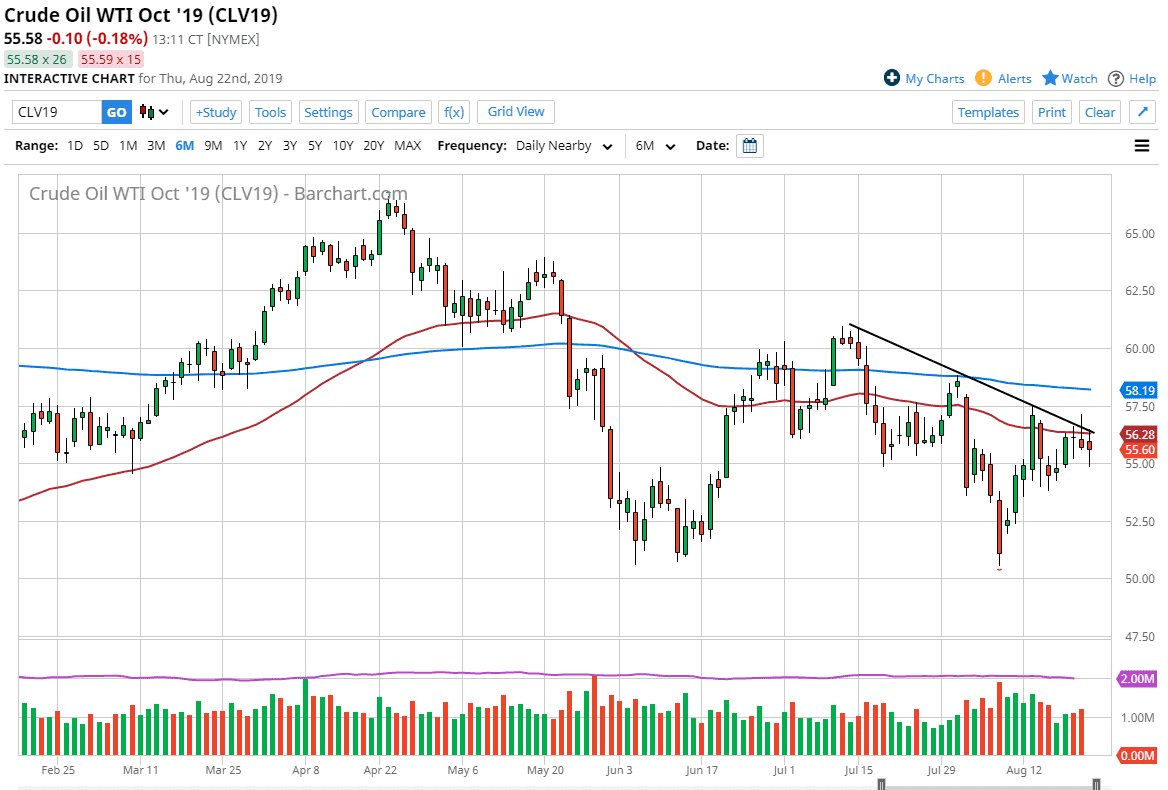
The West Texas Intermediate crude market initially tried to rally during the New York trading session on Thursday, running into a significant amount of resistance. There is a lot of resistance just above based upon not only the 50 day EMA but also the trend line that I have drawn on the chart. The fact that we pulled back from there and then fell rather hard is not a huge surprise considering that there are a lot of global concerns about demand for petroleum out there.
As global growth slows down, there will be much less interest in trying to pick up crude oil, as the demand just won’t be there. Trucking, shipping, and even energy will all drop off. That shouldn’t surprise you, and neither should lower prices based upon that. The trading session from Wednesday ended up forming a shooting star that had initially tried to break through that trend line but failed to stay above there so it was essentially a “failed break out.” By doing so, it shows just how much weakness there really is.
I believe that the market will probably go looking towards the $55 level next, and then eventually the $52.50 level, followed by the $50 level after that. Ultimately, if we did break above the top of the shooting star from the Wednesday session, that would be a bullish sign though and the alternate scenario that what we should be paying attention to. Looking at this chart, if we did break out to the upside the 200 day EMA would of course be the next target which is currently trading at the $58.19 level.
All that being said, the downside is probably much more comfortable to be involved in, and you may have to look towards short-term charts to get that entry. I think at this point we are probably going to look at the short-term charts to get not only entry but possible exits. We can use this daily chart as an opportunity to pick up the trend and pay attention to directionality. Ultimately, the market has shown itself to continue to struggle and therefore I think eventually we will go looking towards that $50 level union, as fears of recession simply don’t jive well with strong oil pricing. Think of it this way: we had recently had a lot of noise coming out of the Middle East when it comes to Iran, and yet nobody cared.

