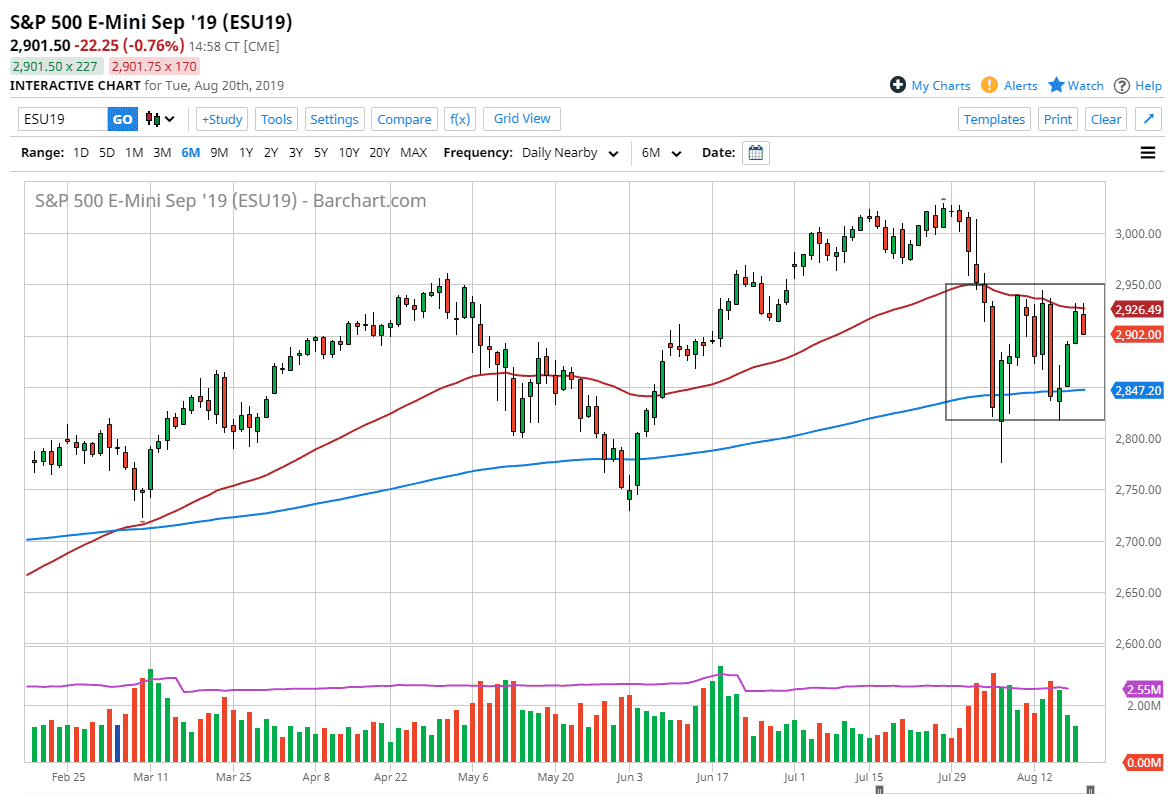
The S&P 500 initially tried to rally during the New York trading session on Tuesday but it struggled above the 50 day EMA yet again. At this point, we have pulled back from that level yet again, and now it looks as if we are going to grind below the 2900 level. The 50 day EMA has been resistance, and now it looks as if the 200 day EMA is going to be support. Looking at the chart, I think it’s obvious that we are stuck in a consolidation over here just as we are in the NASDAQ 100, and I think that’s going to continue to be the case. However, the S&P 500 is a little bit different than the NASDAQ 100 in the sense that we are starting to cave in upon itself. In other words, we could be setting up for a large symmetrical triangle. We could be looking at a huge move coming in the next couple weeks.
Looking at this chart, and the timing, it is not lost on me that two weeks from now we will have a lot of volume reenter the market as traders leave holiday season. If that’s going to be the case, it’s very likely that we will see moves as people get back to the ‘daily grind’ and put the summer behind. This of course could change, but right now it is starting to look more and more like a symmetrical triangle.
To the downside, the 2800 level is support just as the 200 day EMA is, just as the 2950 level is resistance right along with the 50 day EMA. All things being equal, I think that the market will continue to bounce around between these two moving averages, and simply make a lot of noise in the coming sessions. We continue to have a lot of problems between the Americans and the Chinese, so therefore it’s likely that we continue to see a lot of volatile trading. For this reason, it may be wise to wait for some type of breakout unless you simply keep a very small position or to look for options trading opportunities. The underlying fundamentals are not good for the S&P 500, so it’s likely that we will continue to see a lot of fear creep into this marketplace.

