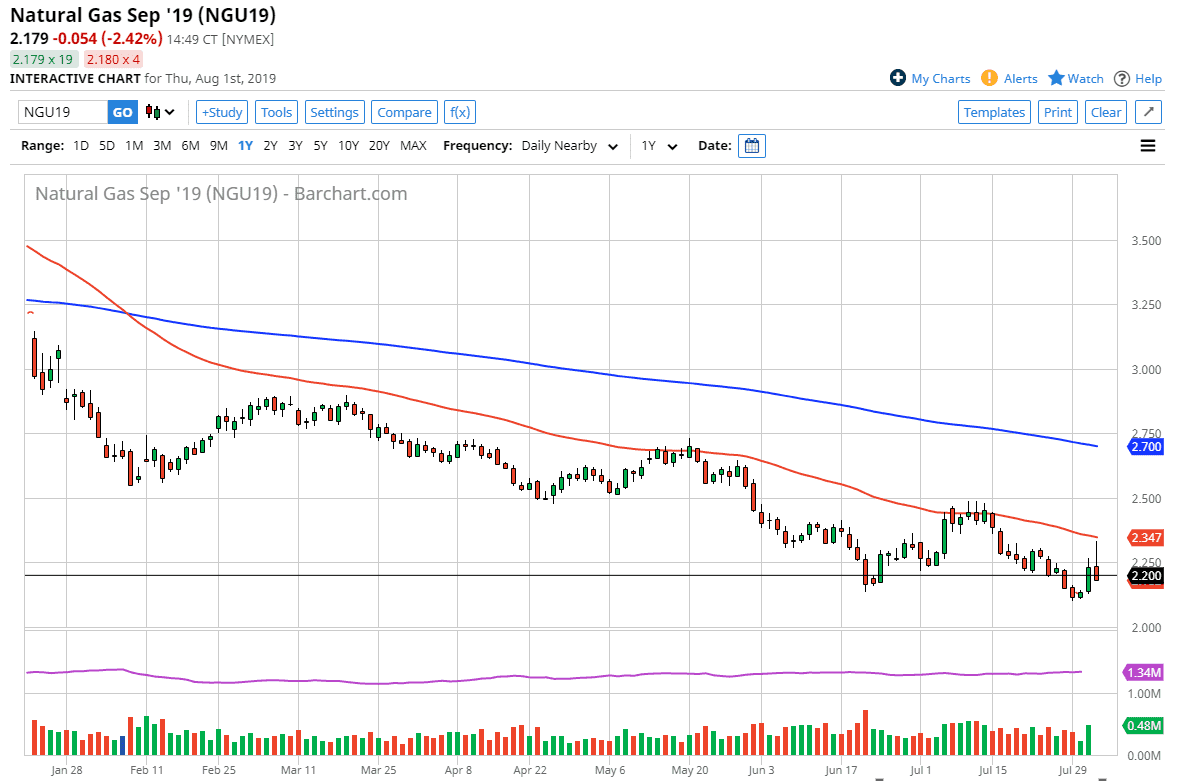
The natural gas markets have initially tried to rally during the trading session on Thursday but have rolled over rather significantly at the 50 day EMA, an area that of course is major resistance and an indicator that the market pays quite a bit of attention to if you look back. All things being equal, the market continues to struggle and therefore I don’t think that there’s any opportunity to buy this market.
After all, this massive downtrend hasn’t changed and therefore it’s very likely that we continue to see negativity. Overall, it’s very likely that the oversupply issue continues, as the natural gas markets simply cannot burn through the massive supply of natural gas that’s out there.
Technical analysis
The technical analysis for this market is relatively straightforward: you should be selling and not buying. At this point in time, it’s likely that any rally that comes along will be squashed, just as we have seen on Thursday. I believe that we are going to go looking towards the $2.10 level initially, which was the most recent low, but I also believe that we are going to go down towards the $2.00 level underneath which is a large, round, psychologically significant number that people will be paying attention to.
If we did break above the 50 day EMA on a daily close, then you could start to have a different conversation but right now it still holds as massive resistance as we have seen for some time. I don’t like the idea of buying natural gas, the chart just looks like death to me.
Structural oversupply
There is a massive structural oversupply of natural gas in the world. The United States alone has over 14,000,000,000,000 ft.³ that they know of just waiting to be extracted from the ground. Canada has even more. United States could power the rest of the world for 300 years based upon what it does, and the Canadians even further. If you have ever seen an oil rig shooting flames out of the top, that’s almost always natural gas being burned off because it’s not worth capturing.
This doesn’t mean that natural gas won’t rise, it most certainly will but there’s no point in fighting this obvious downtrend. The longer-term opportunities could favor the upside, but that’s not going to be until we start trading colder months. Currently, the futures markets are trading the September month, which isn’t necessarily the strongest month.

