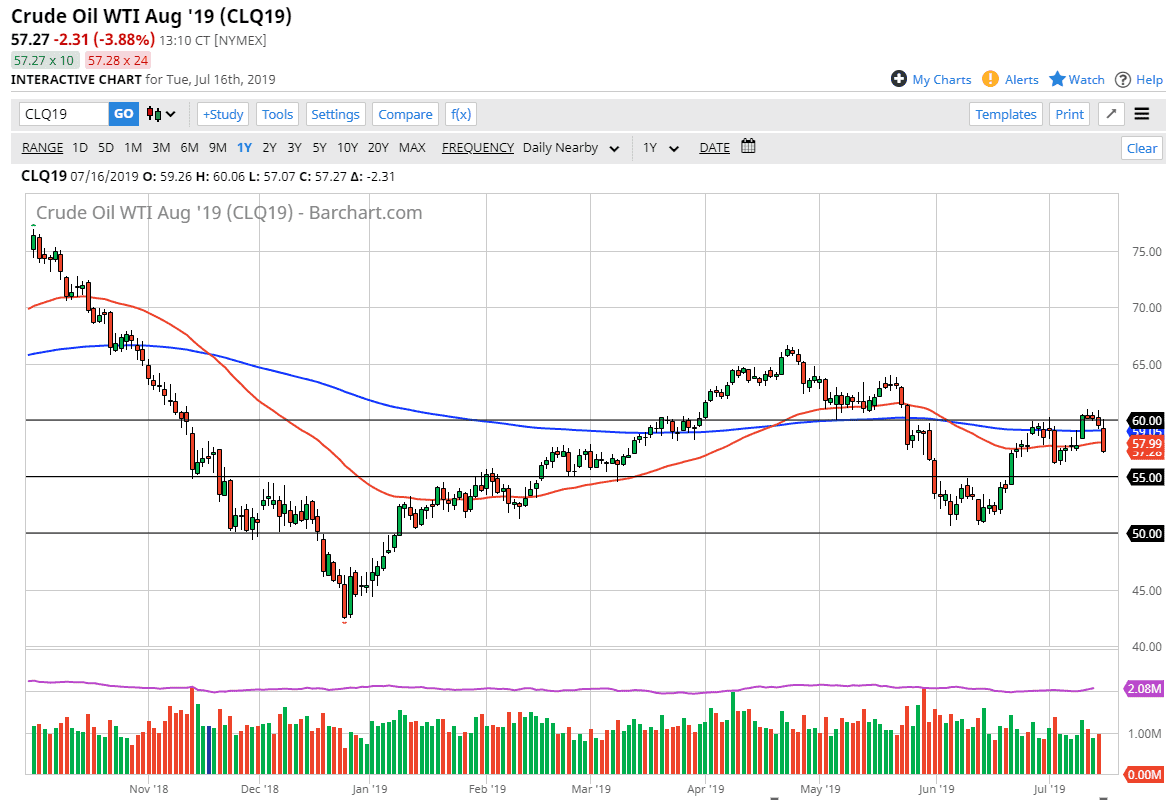
The WTI Crude Oil markets gapped lower to kick off the trading session on Tuesday, turned around to fill that gap and reach towards the $60 level before collapsing. This has been a very negative turn of events, and the fact that we are looking at a daily candle stick that’s closing towards the bottom of the range suggests that we are probably going to see a little bit of follow-through. Markets have lost 4%, which is no joke and it looks like we are going to continue to struggle to hang onto gains.
It looks as if there is a major resistance barrier between the $60 level and the $61 level. With that, I think that the breakdown from the couple of small shooting stars makes quite a bit of sense. The $56 level underneath will be the initial target, but I think that there is a thick “support zone” down to the $55 level. If we can break down below there, then the market can really unwind.
Keep in mind that the crude oil markets are very sensitive to ideas of global growth, and that of course is something that is hurting. The Federal Reserve cutting interest rates does give a little bit of a boost towards the idea of higher commodities, but the reality is that there is a significant concern right now about whether or not the global growth can pick out. We have sliced through the 200 day EMA which is pictured in blue, and then the 50 day EMA underneath in red, and that is an extraordinarily negative sign. I think at this point short-term rallies will probably continue to be opportunities to sell this market at the first sign of exhaustion. I think it’s going to be difficult to find this market one that you can be a buyer of after this candlestick and I would also point out a couple of weeks ago where we had seen a significant bearish candlestick as well. At this point, I believe that we are essentially in a range but with more of a downward attitude than anything else.
If we did turn around and break above the $61 level, that would be a very bullish sign but right now it looks much less likely to happen. Expect volatility and focus on shorter-term charts more than anything else as the choppiness is almost guaranteed.

