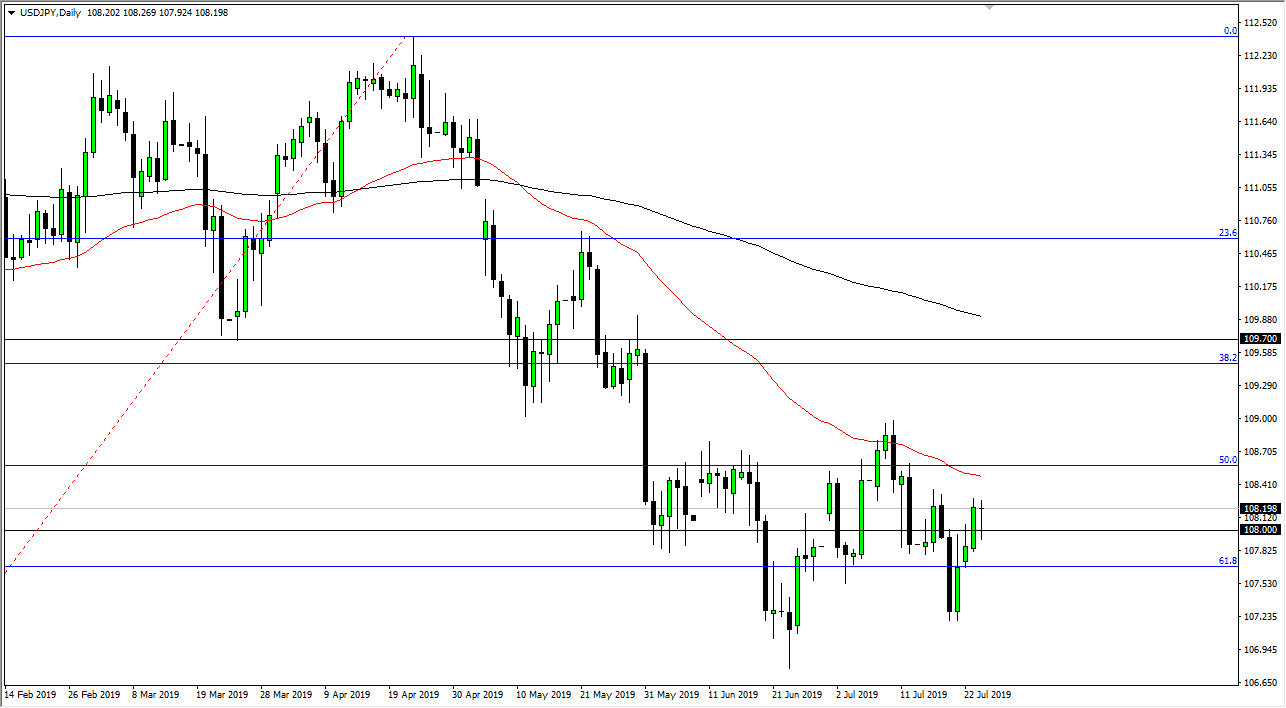
The US dollar initially fell against the Japanese yen during the trading session on Wednesday but found plenty of buyers near the ¥108 level. By doing so we ended up bouncing to form a hammer and that of course is a bullish sign. I think given enough time we will continue to find the markets trying to drive to the upside, perhaps right along with risk appetite as the S&P 500 did fairly well during the day. Because of this, I think it’s probably only a matter time before this pair tries to reach towards the 50 day EMA just above, and it does look like we just formed a bit of a fractal on the daily chart as well.
Looking at this chart, for me I believe that the 50 day EMA won’t be the only place we aim for, but possibly the ¥109 level as well. That’s an area where we have seen sellers jump back in recently, so it makes sense that we could test that yet again. Clearing that level would obviously be very bullish and show US dollar strength, or perhaps more importantly a bit of “risk on” attitude. If that is a scenario that we see in other markets such as the S&P 500, then it makes sense that we would see in here as well.
The range of the candle stick was reasonable, it’s not like we have seen the lot of range, but it wasn’t exactly tiny either. This tells me that there are at least traders out there willing to get involved, so that helps this market, as this time a year is notoriously dead at times. That being said, we should also look at the negative side as well.
If we were to break down below the hammer for the session, it’s very likely that the market will break down towards the bottom of the range that we have been in at the ¥107 level. That level should bring in buyers as well, but right now I think we are essentially in the middle of the medium term range, and I believe that we are simply bouncing between the ¥107 level on the bottom and the ¥109 level on the top. If we can break to the upside of ¥109, then it opens up the door to the 109.70 level next. To the downside if we were to break down below the bottom of the range, we could be looking at ¥105.

