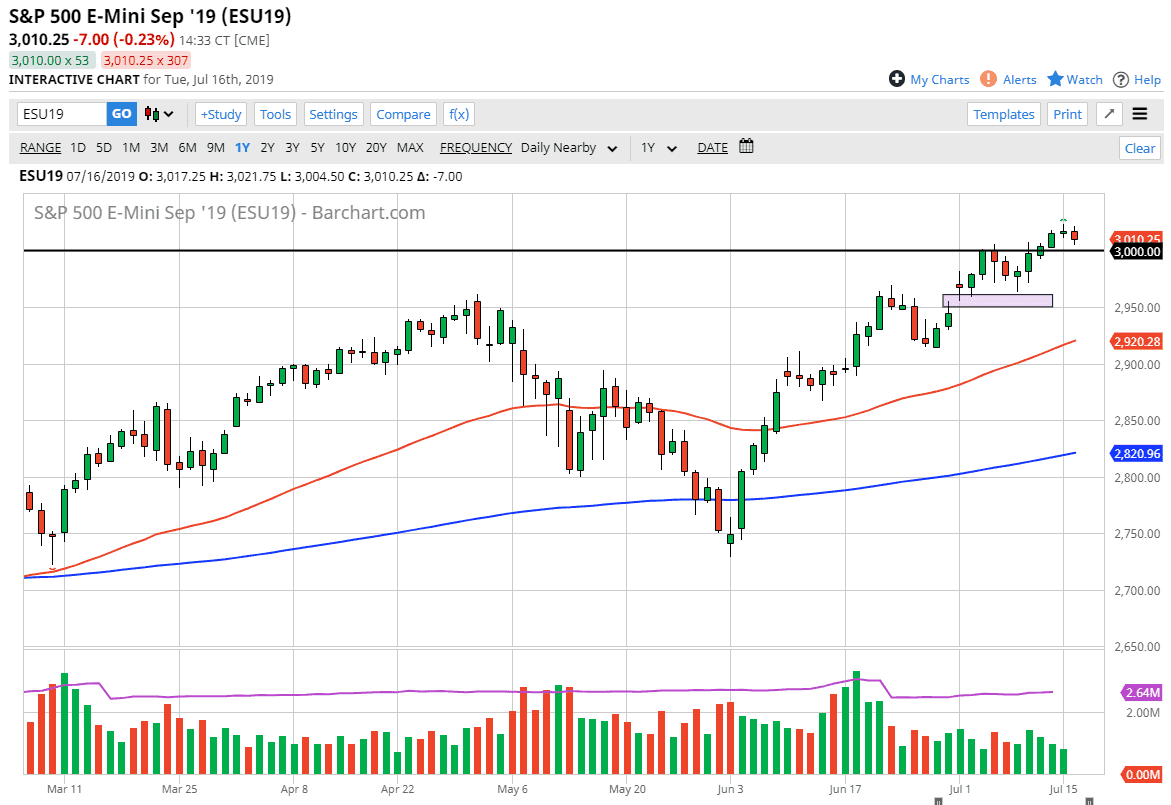
The S&P 500 tried to rally a bit during the trading session on Tuesday, but then broke down towards the 3000 handle. This is an area that obviously will attract a lot of attention, because it is a large, round, psychologically significant figure, and of course it’s an area that offered a bit of resistance. Don’t kid yourself, a lot of trading is simply based upon longer-term round figures, and then the overall trend. I know that seems overly simplistic, but there are funds out there that are so large that that’s how they are forced to trade.
The purple rectangle underneath is massive support that highlights the gap that should offer significant support. The 2950 level is the proxy for that level, and I think given enough time it’s likely that we will see buyers jump into this market based upon value. The question at this point is whether or not we are going to hold the 3000 level, or are we going to go lower in order to pick out value at a lower level.
That being said, it doesn’t necessarily mean that is going to be easy, and it most certainly will be a straight shot higher. I like the idea of pullbacks for value, as the market continues to react to the liquidity measures that are coming from the Federal Reserve. They are going to cut rates, and that will force money into riskier assets such as stocks. We are kicking off earnings season, and that could cause a bit of a short-term reaction but I don’t think that matters. I know that’s heresy for a lot of longer-term and older traders, but at this point in time it’s obviously been all about interest rate cuts coming out of the central banks.
While I don’t like that line of thinking, it’s the reality. As the Federal Reserve is going to cut interest rates, then I think we are going to get a lot of buyers given enough time. To the upside, I believe that the 3025 level will be the next target, and then possibly the 3050 handle after that. I have no interest in shorting this market until we close on a daily chart below the rectangle that you can see on the chart. Overall, any time we pull back from here I’m just going to be looking for signs of support that I can take advantage of on short-term charts.

