S&P 500
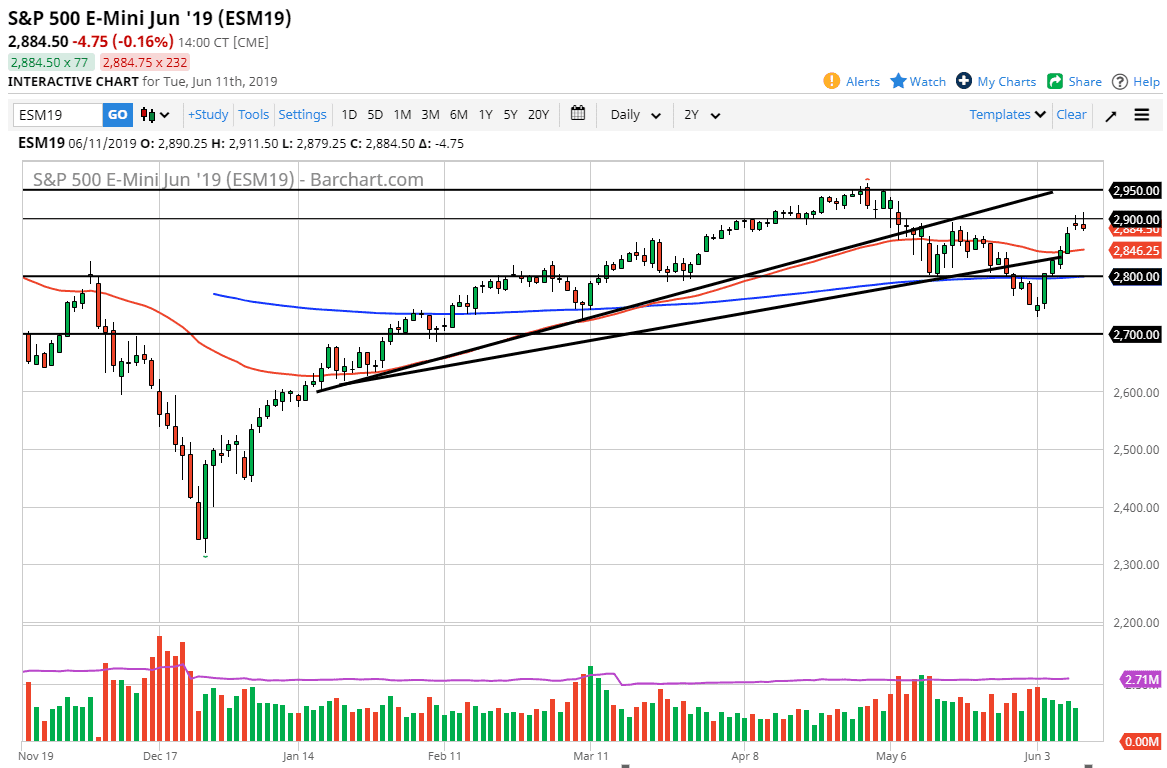
The S&P 500 initially rallied during the trading session on Tuesday, breaking above the 2900 level during the day. By breaking above there, it would have been a very strong sign, but we broke back down below the 2900 level. Having said that, we did of forming a bit of a shooting star and the shooting star of course is very negative. The gap just below should be filled rather quickly, and if we can continue to go below there it’s likely that the 50 day EMA underneath would offer a bit of support as well. On the other hand, if we break above the top of the candle stick that would be a very bullish sign. I believe that short-term rallies will probably be nice selling opportunities on short-term charts, as the market has shown itself to be far too weak to continue to go higher.
NASDAQ 100
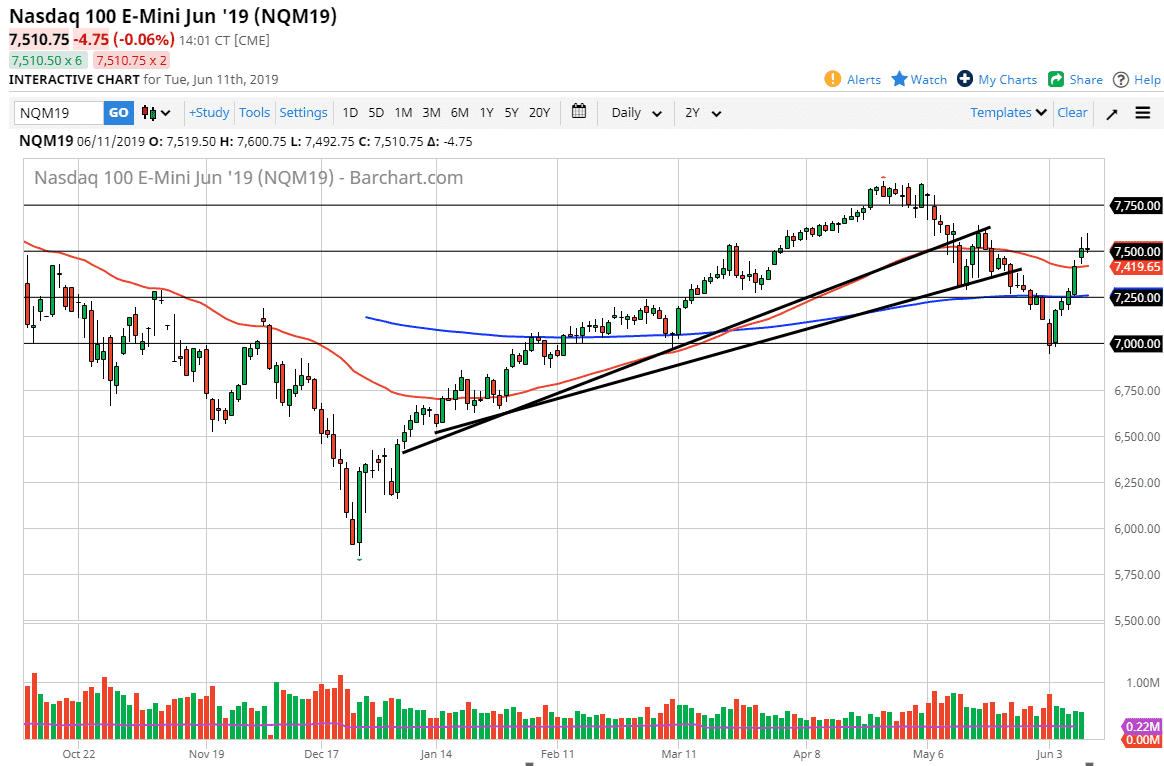
The NASDAQ 100 initially shot towards the 7600 level, which is a large, round, psychologically significant figure. However, we rolled right back over to form a bit of a shooting star which of course is a negative sign. It looks as if the NASDAQ 100 isn’t going to have any easier of a time than the S&P 500, so it’s very likely that we will fall here as well. However, if we did break above the top of the candle stick for the Tuesday session then it opens the NASDAQ 100 too much higher levels, perhaps even the 7700 level.
The NASDAQ 100 of course is very sensitive to the US/China trade situation as a lot of the technology companies have a large footprint in both the United States and China. Overall, with very likely that the market will struggle as well.


