S&P 500
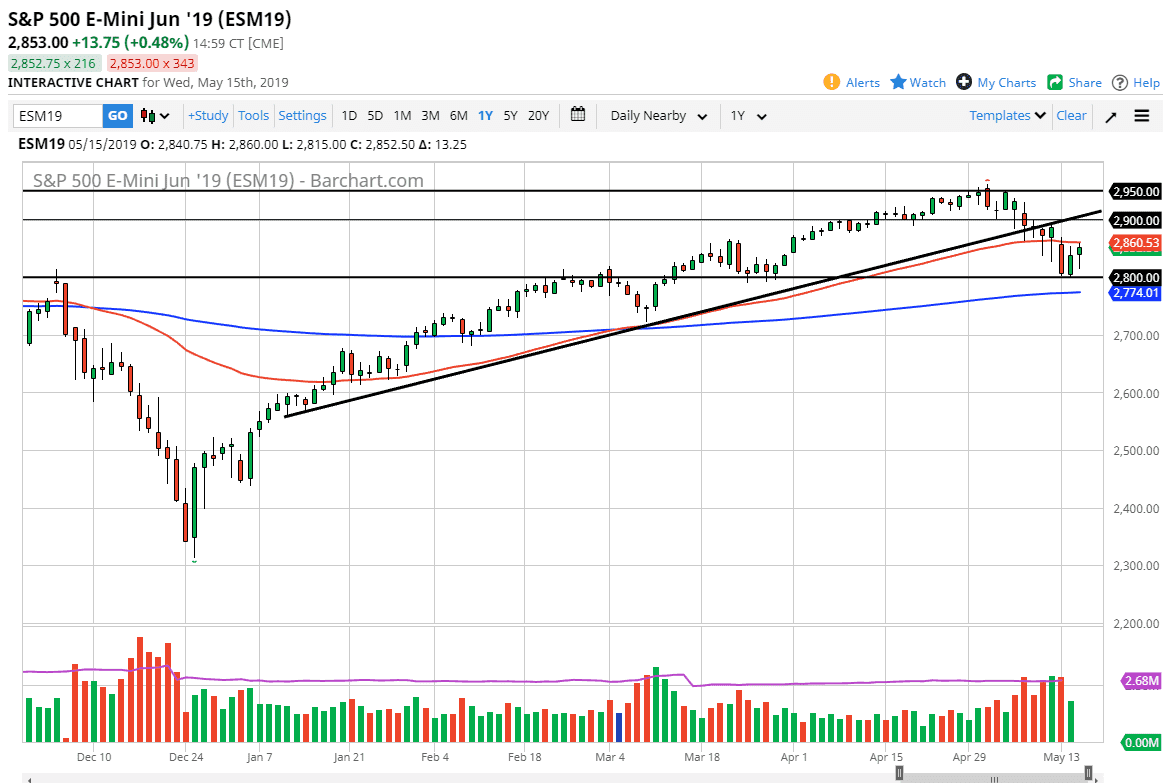
The S&P 500 initially fell during trading on Wednesday but found enough support again towards the 2800 level to turn around of form a nice-looking hammer. That hammer sits just below the 50 day EMA, so that’s something to pay attention to. Above the 50 day EMA is the gap lower from the Monday session that could cause a bit of resistance. If we take that out, then the market is almost certainly going to go to the 2900 level.
That being said, Monday wiped out a couple of hammers, and that is typically a very bearish signal. Because of this I am a bit leery about trying to buy this market right now as I believe we are still very susceptible to bad news. That bad news could come in the form of a Tweet, or some type of economic figure, a random statement and the news out of China, or whole host of other issues.
NASDAQ 100
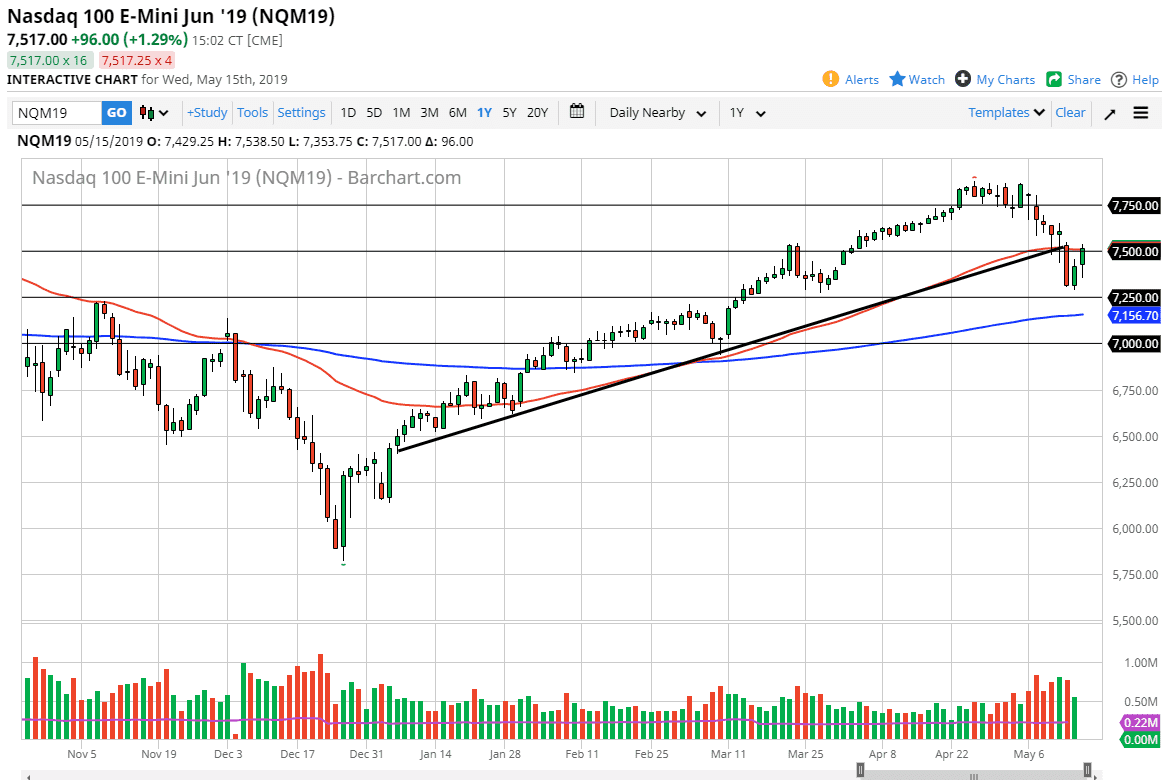
The NASDAQ 100 also is approaching the 50 day EMA and a major gap. It is because of this that I need to see a daily close above that gap to start buying. It is very likely we should see a lot of selling pressure just above, so it would not surprise me to see market participants be a bit skittish in the short term. Keep in mind that the NASDAQ 100 does tend to be quite a bit more sensitive to risk appetite than the S&P 500 so this could be your “canary in the coal mine” when it comes to trading stocks in general. If this market starts to fall, the S&P 500 will go right along with it, and of course the opposite is true.


