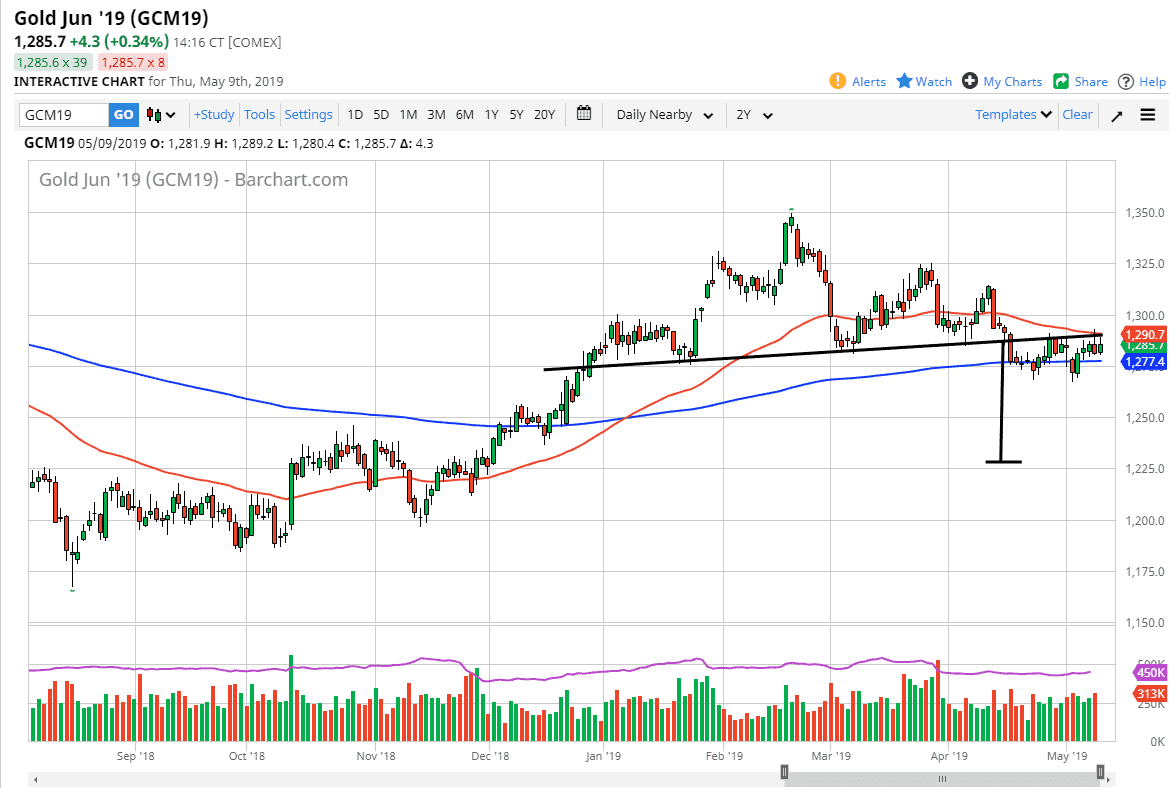
Gold markets rallied initially during the trading session on Thursday but continue to show signs of exhaustion near the $1290 level. Ultimately, this is a market that has recently found a lot of resistance at the previous neckline above, which is connected to the massive head and shoulders. The head and shoulders of course is a very negative pattern, so it does suggest that we are going to break down. The head and shoulders pattern suggests that we could go as low as the $1225 level, but obviously it’s going to take a lot of effort to get down there.
There is a significant amount of support underneath though, and that’s one of the biggest problems right now. We have the 200 day EMA which is pictured in blue, and then the $1268 level which has been very supportive as well. In other words, even though this is a very negative looking chart, the reality is that it’s going to take something significant to break down through here. With the US/China trade relations and focus on Friday, we could get an announcement that could send this market quite drastically in one direction or the other.
Now that you know the downside possibility, the upside possibility should be explored. If we break above the couple of shooting stars that we have formed now, it’s very likely that we could continue to go much higher. The $1300 level would be the initial target, but quite frankly we should go much higher after that because it will completely negate the head and shoulders pattern, and I suspect we will go looking towards the next swing high which is closer to the $1315 region. One thing is for sure, this is about to get really interesting.

