WTI Crude Oil
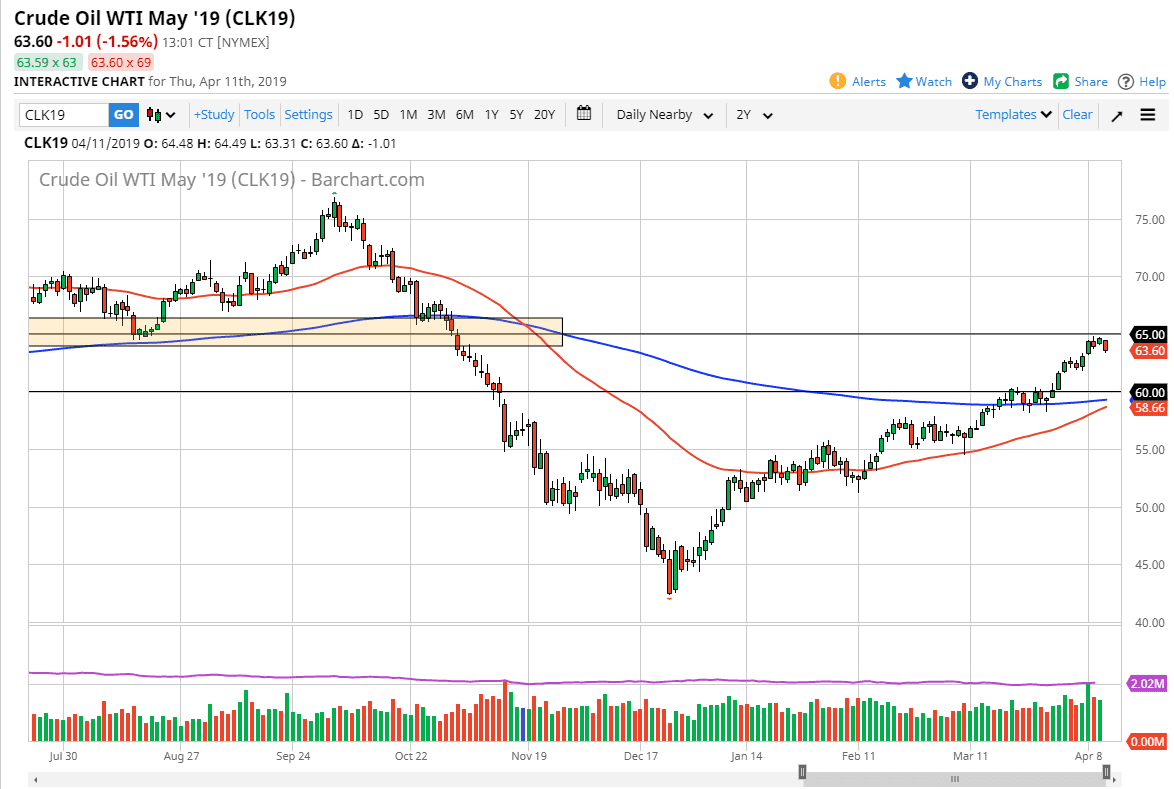
The WTI Crude Oil market fell a bit during the trading session on Thursday, as the $65 level continues to be a bit too much for the markets to deal with. However, there is support underneath that could come into play rather quickly, so pay attention to the short-term charts to get a bit of a feeling for where we could go next. Overall, it’s likely that we will have more of a “buy on the dips” attitude going forward as the market has been so strong. Beyond that, we also have a lot of talk about a tightening global supply chain, so that of course will continue to lift crude oil. At this point though, we may just simply be a little bit stretched. I continue to like buying those dips, especially as we approach places like the $62.50 level underneath.
Natural Gas
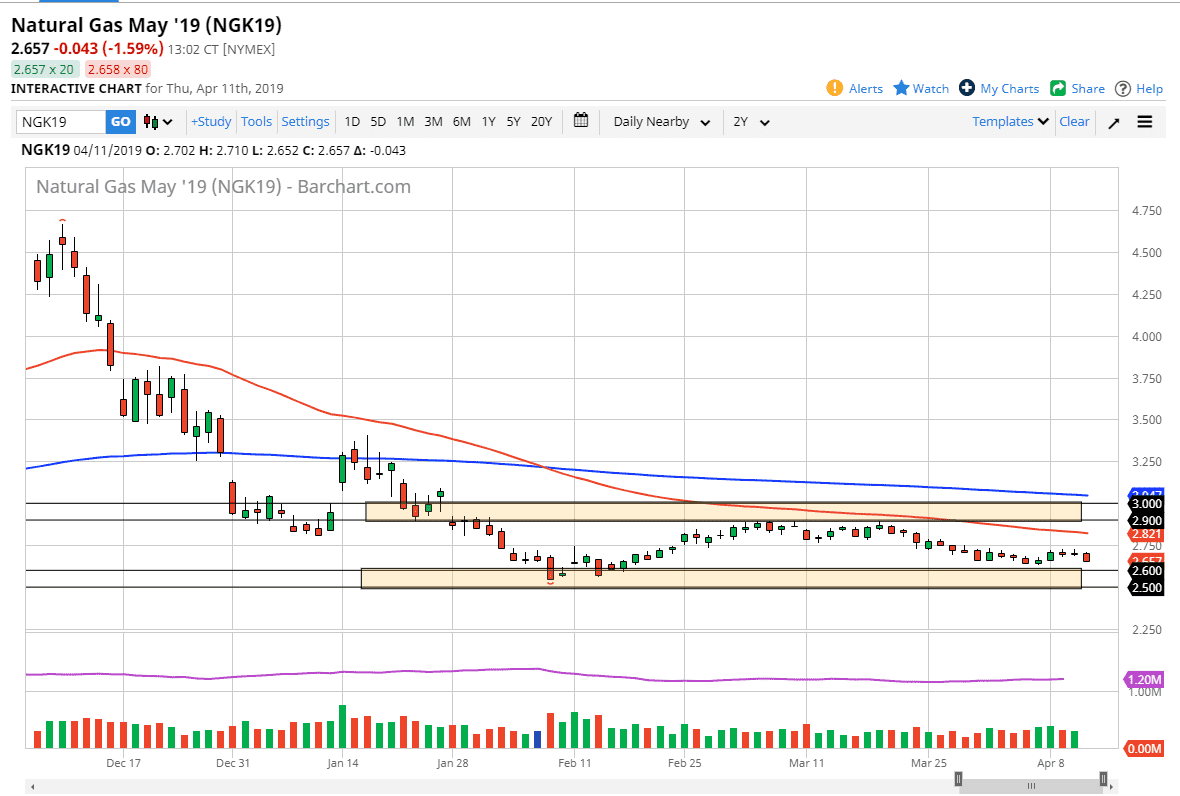
Natural gas markets fell a bit during the trading session on Thursday as the inventory number was of course a bit more bearish than expected. That being the case, it looks like we are going to drop down towards the $2.60 level, which is the beginning of massive support barrier that goes all the way down to the $2.50 level underneath. Any sign of a bounce on the short-term chart is probably an opportunity to pick up natural gas for a quick move, but I would not be expecting some type of major bullish change in attitude. Keep in mind that we have been stuck in a trading range for some time, and as we are in the wrong time of year to have overly bullish action, it makes sense that we will probably just bounce around between the $2.90 level and the $2.60 level as I have marked on the chart.


