
Start Trading Now Get Started
Table of Contents
Advertiser Disclosure
Advertiser Disclosure DailyForex.com adheres to strict guidelines to preserve editorial integrity to help you make decisions with confidence. Some of the reviews and content we feature on this site are supported by affiliate partnerships from which this website may receive money. This may impact how, where and which companies / services we review and write about. Our team of experts work to continually re-evaluate the reviews and information we provide on all the top Forex / CFD brokerages featured here. Our research focuses heavily on the broker’s custody of client deposits and the breadth of its client offering. Safety is evaluated by quality and length of the broker's track record, plus the scope of regulatory standing. Major factors in determining the quality of a broker’s offer include the cost of trading, the range of instruments available to trade, and general ease of use regarding execution and market information.
toc-menu-hamburger.png
table of content

Table of Contents

toggle-toc.png

S&P 500 and Nasdaq Forecast - 14 March 2019

By Christopher Lewis
Senior Technical Analyst

Christopher Lewis is a technical analyst and market commentator at DailyForex with more than two decades of trading experience in Forex and other leveraged markets. Based in Columbus, Ohio, he specializes in chart-based analysis of major currency pairs, stock indices, commodities, and energy markets, focusing on clear support and resistance levels, trend structure, and risk management. Christopher produces daily written and video analysis for tra...

Read more

S&P 500

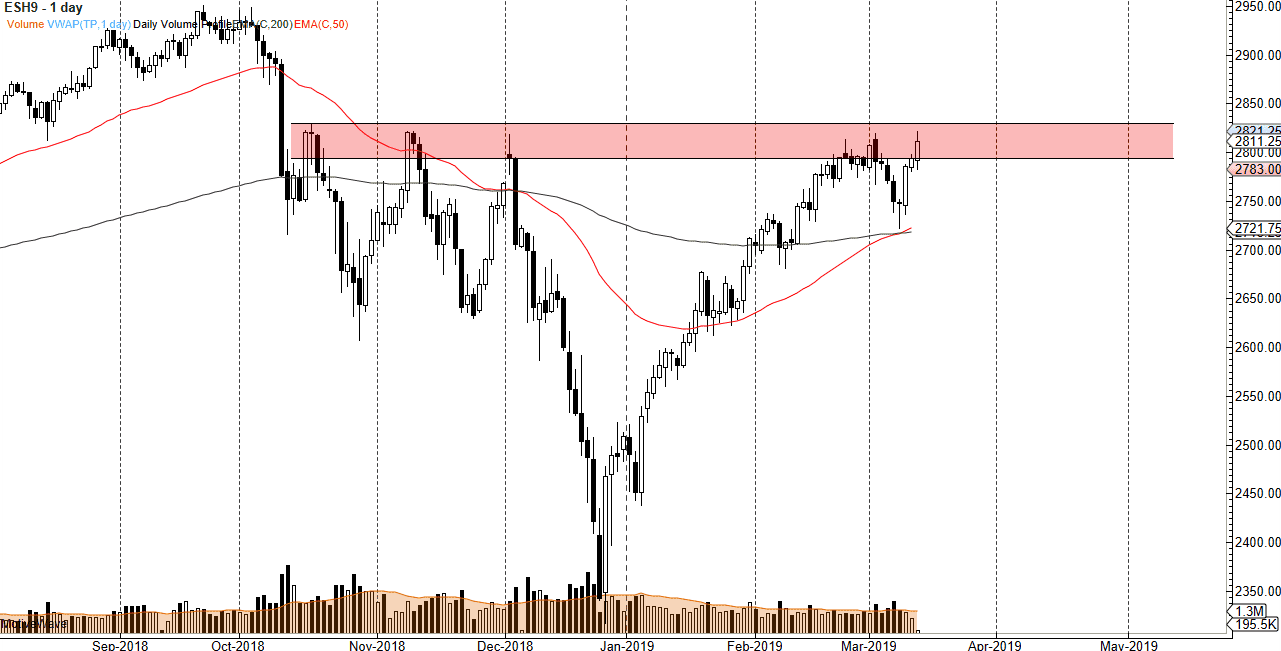
The S&P 500 rallied a bit during the trading session on Wednesday, reaching towards the highs again. We have given back a bit towards the end of the day though, so it shows just how much work there is to be done when it comes to breaking out. I think at this point we are likely to see a short-term pullback but that pullback should be thought of as a potential buying opportunity. As we are closing above the 2800 level, that’s a good sign but really it’s the 2820 region that we need to clear in order to have the “all clear” to go along for a bigger move. If we were to break down below the 2780 handle, we will probably drop to the 2750 level, so keep that alternative scenario in mind.
SP 500

NASDAQ 100

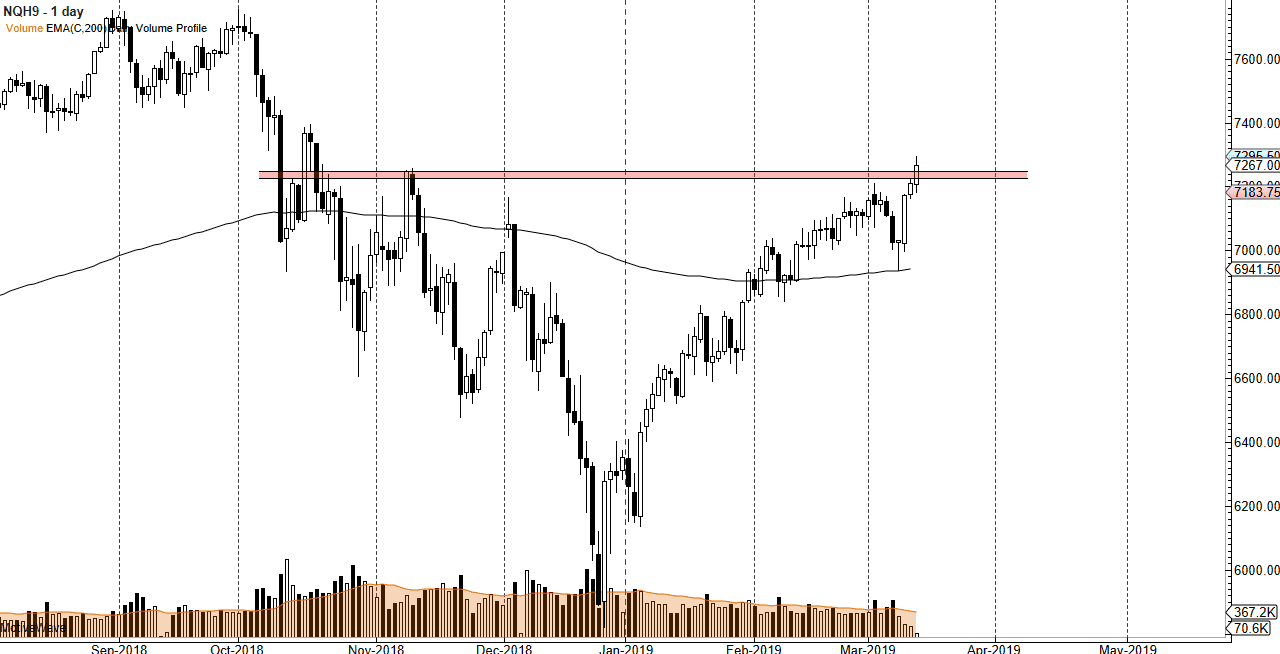
The NASDAQ 100 broke higher during the trading session, clearing a bit of a resistance barrier to go higher. It now looks as if we are probably going to target the 7400 level, but we may need to pull back slightly to test the 7250 level for support on short-term charts. I would be very interested in buying a supportive candle on a shorter timeframe in that area, or a break above the daily candle stick for the Wednesday session. Both of those would be excellent opportunities to go long in aim for the 7400 level above which is the next major area of selling that we have seen in the past.

The alternate scenario is that we break down below the 7100 level. If we do, then we probably crash right back to the 7000 level, possibly even lower than that given enough time. Keep in mind that the 200 day EMA is right around that level though.
Nasdaq

Senior Technical Analyst
Christopher Lewis is a technical analyst and market commentator at DailyForex with more than two decades of trading experience in Forex and other leveraged markets. Based in Columbus, Ohio, he specializes in chart-based analysis of major currency pairs, stock indices, commodities, and energy markets, focusing on clear support and resistance levels, trend structure, and risk management. Christopher produces daily written and video analysis for traders who rely on technical setups to navigate volatile market conditions

As seen on: Pairs Of Aces Podcast,The Trader Guy, FXEmpire

Most Visited Forex Broker Reviews