The difference between success and failure in Forex trading is very likely to depend upon which currency pairs you choose to trade each week, and not on the exact trading methods you might use to determine trade entries and exits. Each week I am going to analyze fundamentals, sentiment and technical positions in order to determine which currency pairs are most likely to produce the easiest and most profitable trading opportunities over the next week. In some cases it will be trading the trend. In other cases it will be trading support and resistance levels during more ranging markets.
Big Picture 17th February 2019
In my previous piece last week, I was bullish on the USD/SEK currency pair. It closed the week up, but by only 0.02%.
Last week saw the strongest rise in the relative value of the New Zealand Dollar, and the strongest fall in the relative values of the Japanese Yen.
Last week’s Forex market was less active, with markets generally dominated by a continuing strong recovery in the U.S. stock market and the price of crude oil, both of which are breaking strongly to close at new multi-week high prices as the U.S. government shutdown was resolved. Gold looks quite strong, while the Euro looks relatively weak.
This week is likely to be dominated by crucial central bank input on the U.S. and Australian Dollars.
Fundamental Analysis & Market Sentiment
Fundamental analysis looks quite bullish on the U.S. Dollar. The stock market has continued to recover from its lows and is close to being in a technical bull market again, with the major indices already trading above their respective 200-day moving averages. There are fears over the seeming high sensitivity of the economy to any further rate hikes, as evidenced by the fact that the FOMC appears to have largely given up on its originally planned further rate hikes for 2019. The ongoing trade dispute with China appears to be moving towards a positive resolution, which is a good sign.
Legally, only six weeks remain until the U.K. leaves the European Union, and the default position is that there will be no deal unless one is agreed before that date. The E.U. are refusing to offer any substantial concessions on their offered terms of a deal, so we can expect continuing political uncertainty and machinations over the next few weeks in the U.K.
The ECB has recently taken a more dovish line on the Euro and the Euro weakened again last week. The Swedish Krona is also very weak, again hitting new 2-year lows on a strong bearish breakdown against the U.S. Dollar, as fears mount over the significance of data indicating a deterioration in the Swedish economy.
Precious metals, especially Gold, still look strong, as does Crude Oil.
Technical Analysis
U.S. Dollar Index
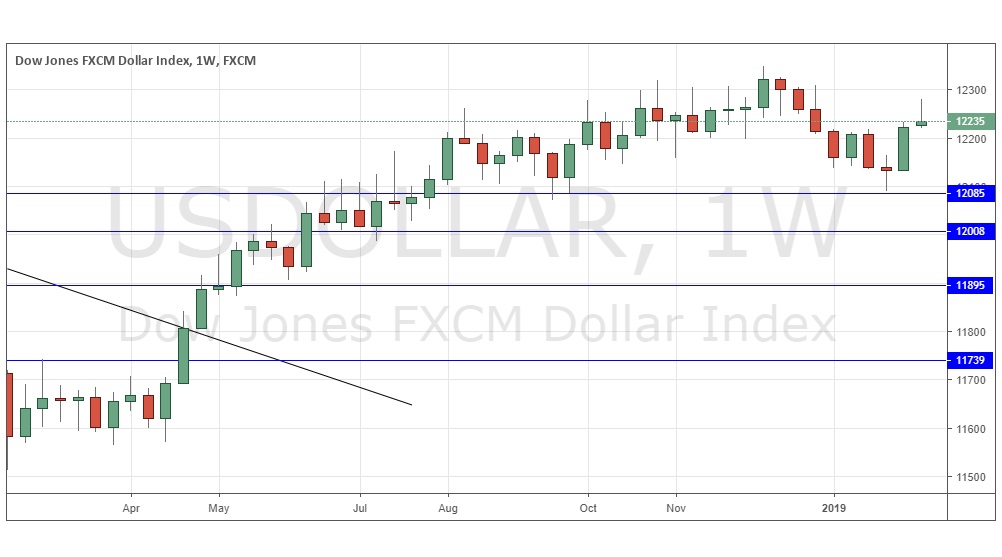
The weekly price chart below shows that last week the USD Index rose very slightly, printing a small pin candlestick following a recent low which was very close to the support level identified at 12085. The price is down over 3 months, but up over 6 months, so we have a more mixed picture on the Dollar. The candlestick is hard to judge so next week’s direction looks very uncertain.
Dow Jones 30 Index
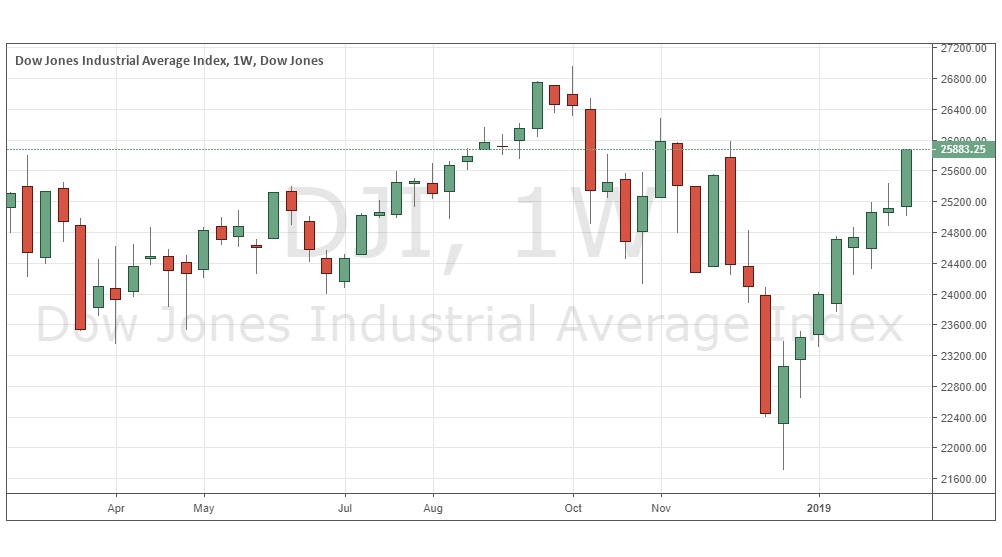
The weekly chart below shows last week produced a relatively large, strongly bullish candlestick, which reached and closed at its highest close for 3 months, right at the high of the candlestick. Such strong movement in the U.S. stock market tend to continue and we have seen a strong recovery since the end of 2018, with the bear market recovering strongly and by some measurements it is already back in a bull market. The move in old-fashioned Down Jones 30 stocks is stronger than in the broader S&P 500 Index.
GOLD/USD
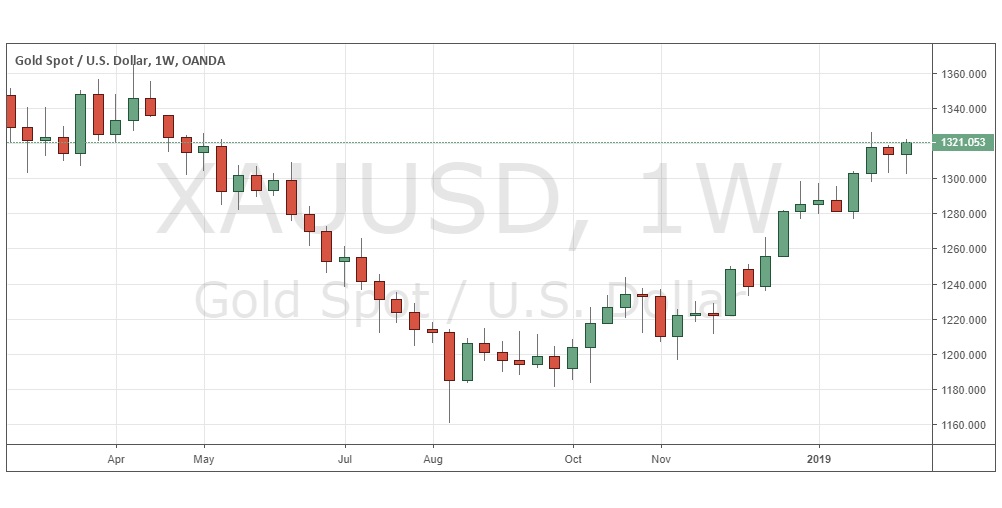
The weekly chart below shows last week printed a relatively small yet bullish candlestick closing very close to its high. This was the highest weekly close in approximately 10 months. The long-term bullish trend and nearby support levels are intact, suggesting we may well see higher prices still. However, the momentum is not very strong, so we may well see a failure at the previous swing high which was printed two weeks ago. There is also resistance not far above at $1332.93.
Conclusion
This week I am bullish on the Dow Jones Industrial Average Index.


