
Start Trading Now Get Started
Table of Contents
Advertiser Disclosure
Advertiser Disclosure DailyForex.com adheres to strict guidelines to preserve editorial integrity to help you make decisions with confidence. Some of the reviews and content we feature on this site are supported by affiliate partnerships from which this website may receive money. This may impact how, where and which companies / services we review and write about. Our team of experts work to continually re-evaluate the reviews and information we provide on all the top Forex / CFD brokerages featured here. Our research focuses heavily on the broker’s custody of client deposits and the breadth of its client offering. Safety is evaluated by quality and length of the broker's track record, plus the scope of regulatory standing. Major factors in determining the quality of a broker’s offer include the cost of trading, the range of instruments available to trade, and general ease of use regarding execution and market information.
toc-menu-hamburger.png
table of content

Table of Contents

toggle-toc.png

S&P 500 and Nasdaq Forecast - 3 December 2018

By Christopher Lewis
Senior Technical Analyst

Christopher Lewis is a technical analyst and market commentator at DailyForex with more than two decades of trading experience in Forex and other leveraged markets. Based in Columbus, Ohio, he specializes in chart-based analysis of major currency pairs, stock indices, commodities, and energy markets, focusing on clear support and resistance levels, trend structure, and risk management. Christopher produces daily written and video analysis for tra...

Read more

S&P 500

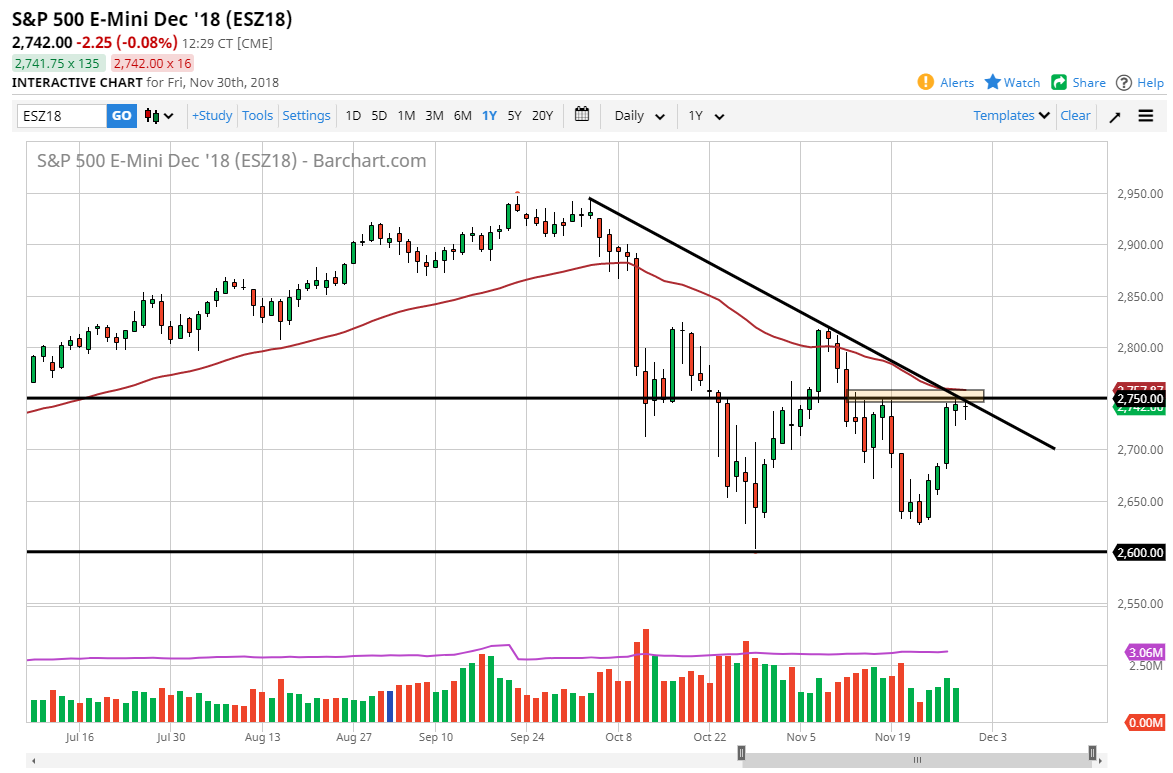
The S&P 500 initially pulled back a bit during the day on Friday as the world awaits the results of the meeting between Donald Trump and President Xi on Saturday, which of course will give us a window into how trade negotiations may work out. As you can see on the chart, there is a major downtrend line as well as significant horizontal resistance at the 2750 level that coincides with the 50 day EMA. Ultimately, if we can break above there, it’s a very bullish sign in the market could go to the 2800 level. This will all come down to whether or not the Americans and Chinese can play nice, and if they do that should kick off the rally. Otherwise, if the meeting becomes cantankerous, that could send this market lower. At this point, it’s a binary event.
SP 500

NASDAQ 100

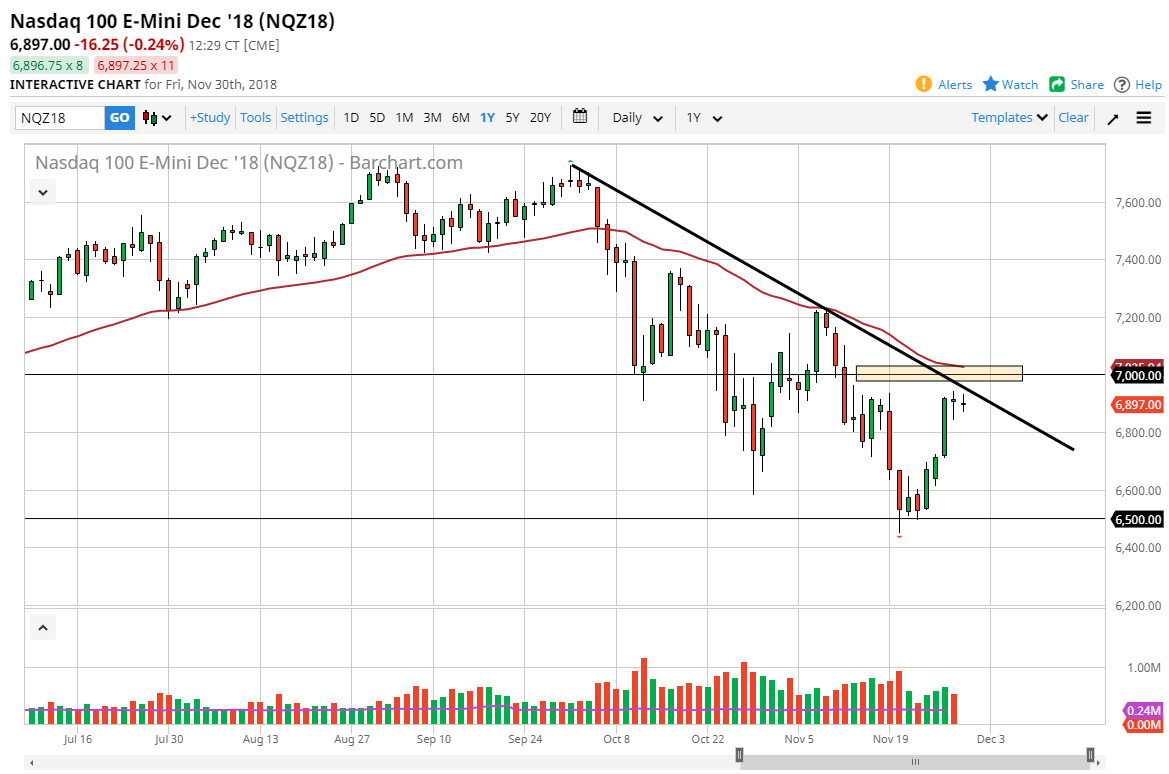
The NASDAQ 100 also is at a major crossroads as well, with the 50 day EMA just above offering resistance at the 7000 region. Beyond that, there is a downtrend line, and therefore I think we should have a lot of noise in the short term area. However, at this point I think that the fate of the NASDAQ 100 is almost entirely resting on the idea of the meeting as well, and therefore I think that if we can break above the 7000 handle, then the market should continue to go towards the 7200 level, possibly higher than that rather quickly. Otherwise, if we get bad news out of the meeting it’s likely that we go to the 6800 level, and then possibly even the 6600 level after that. The NASDAQ 100 is highly levered to the US/China trade relations, as most companies in this list do business in both countries.
Nasdaq

Senior Technical Analyst
Christopher Lewis is a technical analyst and market commentator at DailyForex with more than two decades of trading experience in Forex and other leveraged markets. Based in Columbus, Ohio, he specializes in chart-based analysis of major currency pairs, stock indices, commodities, and energy markets, focusing on clear support and resistance levels, trend structure, and risk management. Christopher produces daily written and video analysis for traders who rely on technical setups to navigate volatile market conditions

As seen on: Pairs Of Aces Podcast,The Trader Guy, FXEmpire

Most Visited Forex Broker Reviews