Table of Contents
Affiliate Disclosure
Affiliate Disclosure DailyForex.com adheres to strict guidelines to preserve editorial integrity to help you make decisions with confidence. Some of the reviews and content we feature on this site are supported by affiliate partnerships from which this website may receive money. This may impact how, where and which companies / services we review and write about. Our team of experts work to continually re-evaluate the reviews and information we provide on all the top Forex / CFD brokerages featured here. Our research focuses heavily on the broker’s custody of client deposits and the breadth of its client offering. Safety is evaluated by quality and length of the broker's track record, plus the scope of regulatory standing. Major factors in determining the quality of a broker’s offer include the cost of trading, the range of instruments available to trade, and general ease of use regarding execution and market information.
toc-menu-hamburger.png
table of content

Table of Contents

toggle-toc.png

S&P 500 and Nasdaq Forecast - 19 November 2018

S&P 500

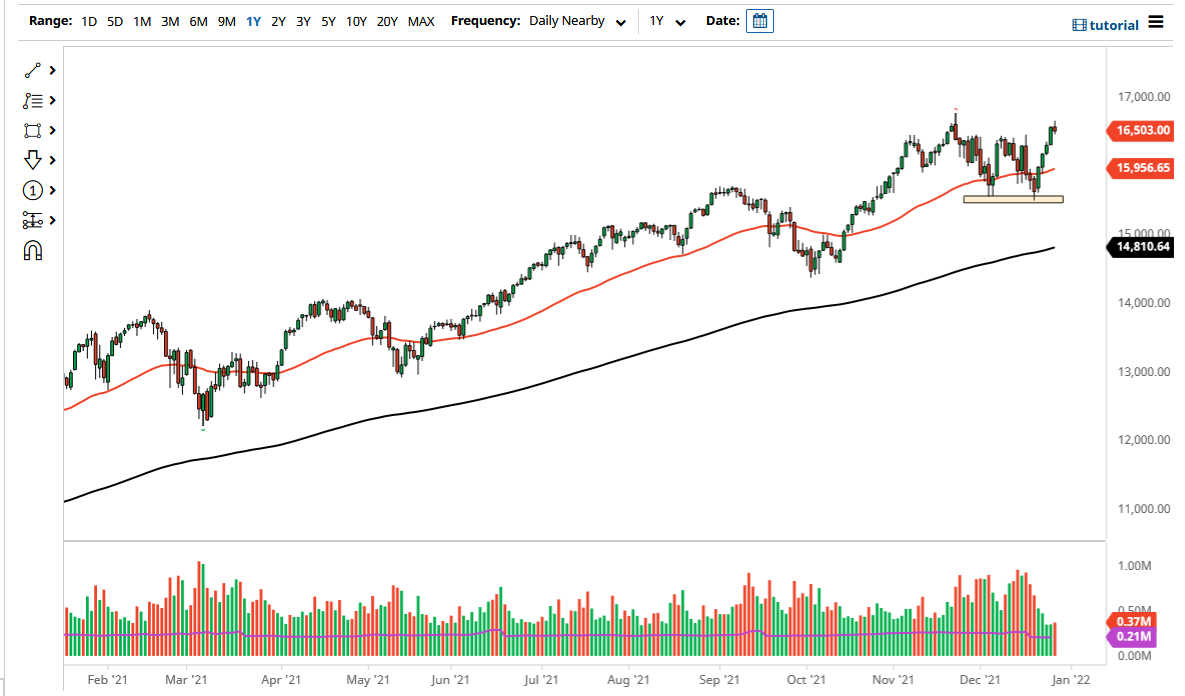
The S&P 500 initially pulled back during the trading session on Friday, and then turned around to form a bit of a hammer. We are sitting underneath the 2750 handle, which is an area that has been resistance. I believe that if we break above there, the market will probably go looking towards the 50 day EMA, and then perhaps the recent highs. I think at this point, if we break down below the bottom of the hammer for the session on Friday, then we go looking towards the 2700 level, the 2650 level, and then eventually the 2600 level after that. There are a lot of concerns out there about global trade and of course interest rates, so I think that the S&P 500 is still susceptible to sudden selloffs.

sp500

NASDAQ 100

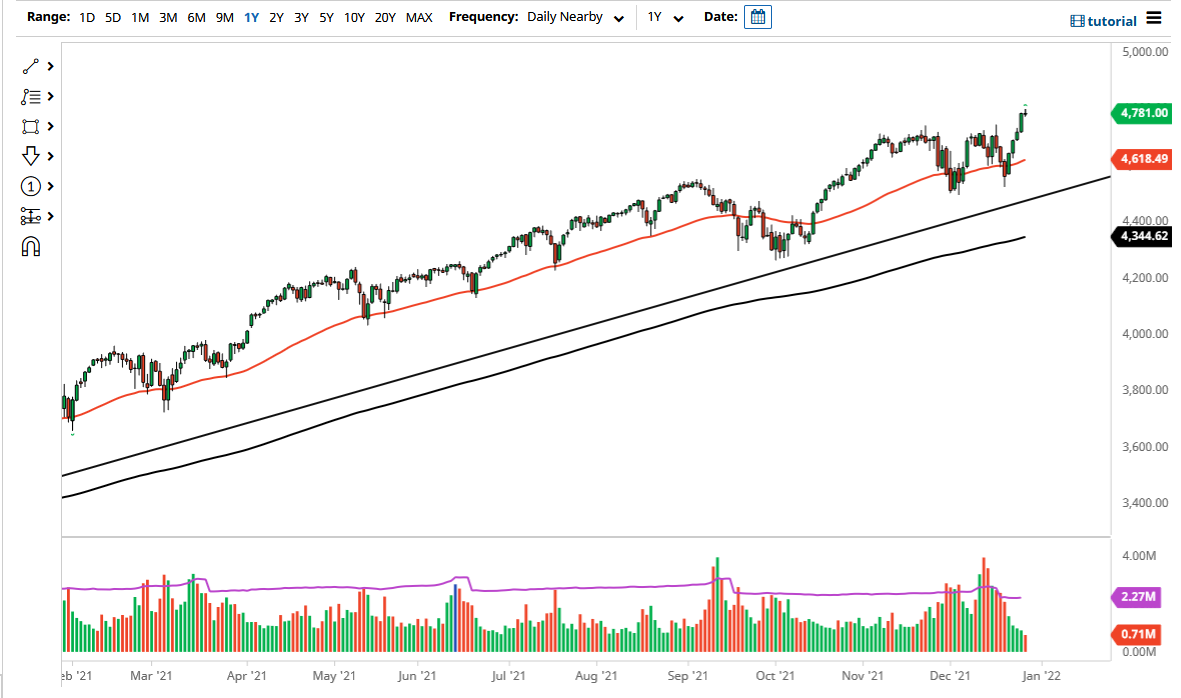
The NASDAQ 100 has also seen a back-and-forth type of session, initially gapping lower and then going down towards the 6800 level, only to turn around of form a bit of a hammer. At this point, I think there is a lot of resistance above at the 7000 handle, an area that has been important more than once. I think the 50 day EMA on the chart shows a lot of exhaustion and negativity in this market, so I think that we won’t be able to break above there anytime soon. The other scenario of course is that we have just formed a bit of a double bottom, but I think that is a bit of speculation at this point at best. The US/China situation continues to weigh upon technology stocks, and we have just seen Nvidia get whacked for 20%. That shows just how soft tech could be.

nasdaq100

Adam Lemon
About Adam Lemon

Adam Lemon began his role at DailyForex in 2013 when he was brought in as an in-house Chief Analyst. Adam trades Forex, stocks and other instruments in his own account. Adam believes that it is very possible for retail traders/investors to secure a positive return over time provided they limit their risks, follow trends, and persevere through short-term losing streaks – provided only reputable brokerages are used. He has previously worked within financial markets over a 12-year period, including 6 years with Merrill Lynch.


Most Visited Forex Broker Reviews