Gold prices settled at $1323.35 an ounce on Friday, ending a choppy week virtually unchanged. XAU/USD rose slightly on Friday after hitting a one-week low as the dollar drifted lower after the February jobs report showed that the U.S. economy added 313000 jobs but the pace of wage growth eased. Global stock markets were mostly firmer last week, though there was a dose of uncertainty in the marketplace from the Trump administration’s tariff moves. A solid rebound in the U.S. stock market from its recent slide may continue to pressure the safe-haven metal in near term. The latest data from the Commodity Futures Trading Commission (CFTC) showed that speculative traders on the Chicago Mercantile Exchange increased their net-long positions in gold to 183823 contracts, from 178718 a week earlier.
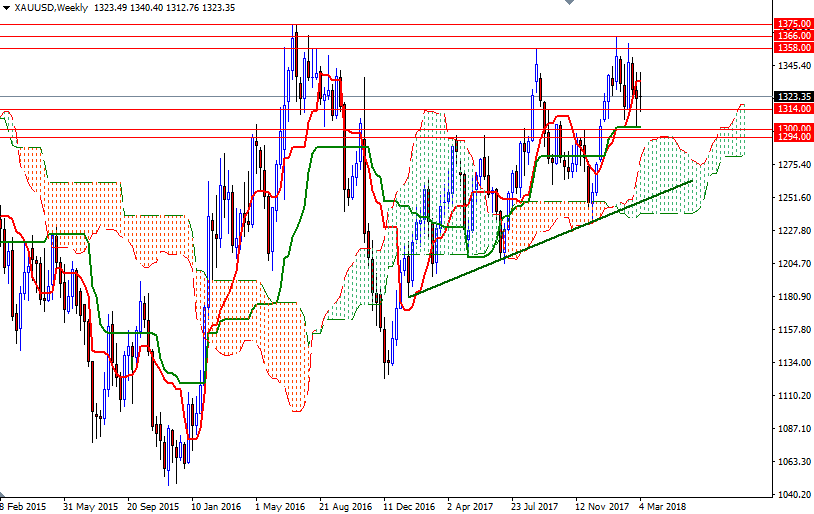
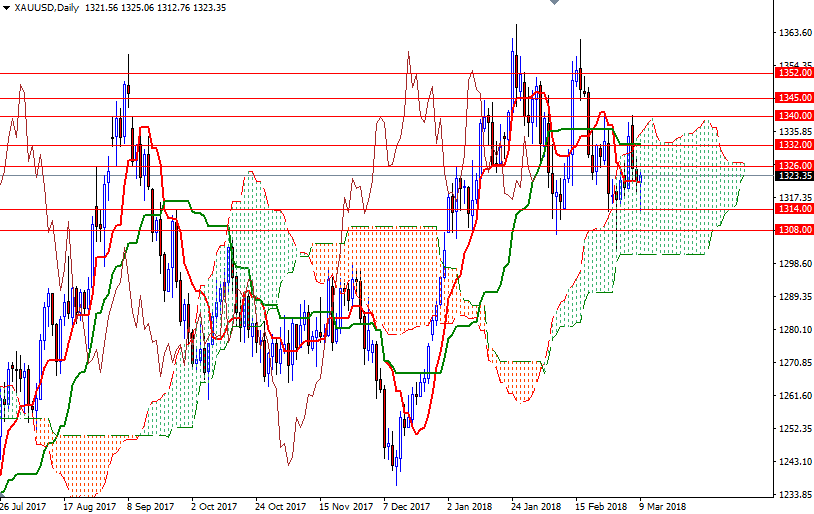
Gold is currently lacking a clear driver but the tall lower shadow of Friday’s candle suggests lower prices entice buyers back into the market. The weekly candle, on the other hand, as well as trading within the borders of the daily Ichimoku clouds suggests that the market is looking for a direction. The Tenkan-sen (nine-period moving average, red line) and the Kijun-sen (twenty six-period moving average, green line) lines, which are in a flat position on the daily and the weekly charts, supports this view. Besides, we are still in a consolidation box that I highlighted in my monthly analysis.
The bears have to clear nearby supports such as 1316/4 and 1308/5. If the support in the 1308/5 area is broken, then the bears will be targeting 1301/0, the bottom of the daily cloud. A break below 1300 on a daily basis would pave the way for a test of 1294/2. To the upside, XAU/USD has to anchor above the 1329/6 zone to revisit 1334.32-1332. If the bulls break through this barrier, they will have another chance to challenge 1340. Beyond there, the 1347/5 area stands out as a key technical resistance.


