BTC/USD
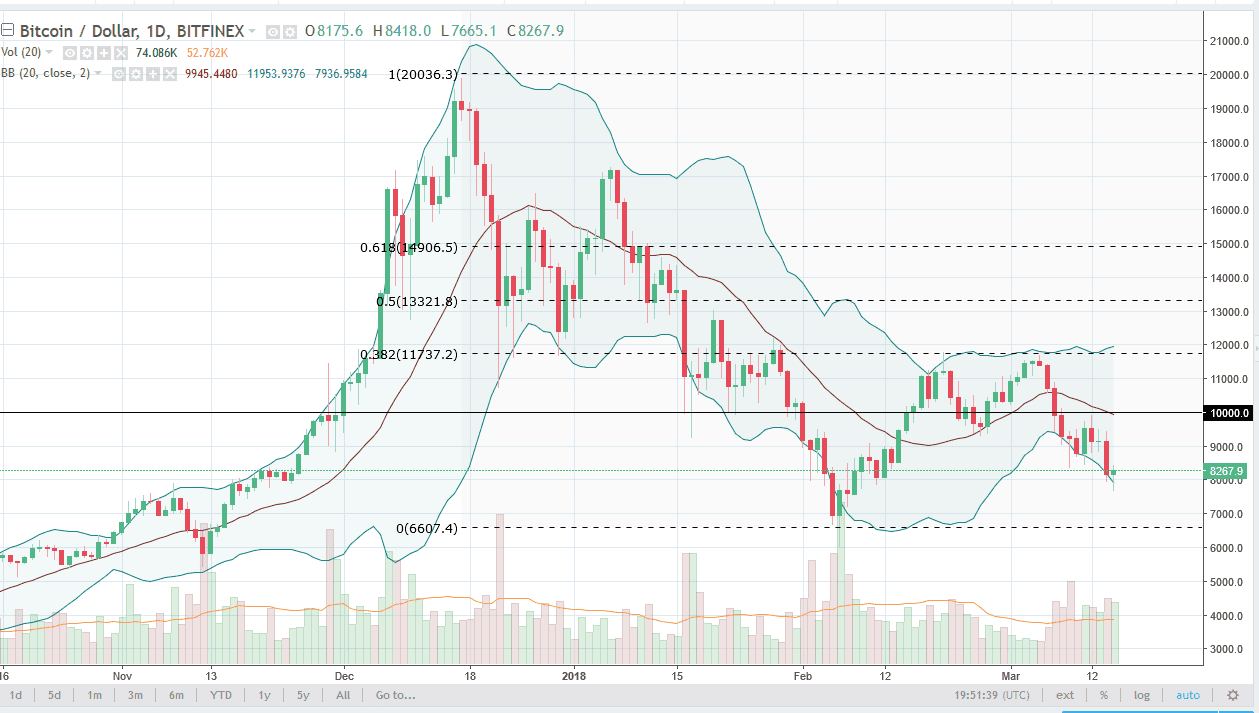
Bitcoin fell initially during trading on Thursday, but as you can see turned around to form a bit of a hammer on the daily chart. That’s a very bullish sign, and we are testing the bottom of the Bollinger Band, so there is the possibility of a bounce from here. I think that if we break above the range for the day, we could go higher for the short term, but it’s not until we break above the $10,000 level that I would be impressed. I suspect that if we rally from here, it will only end up being a sell the rallies type of move. If we break down below the bottom of the hammer, then I think we wipe out the entire rally and go back to the $7000 level.
BTC/JPY
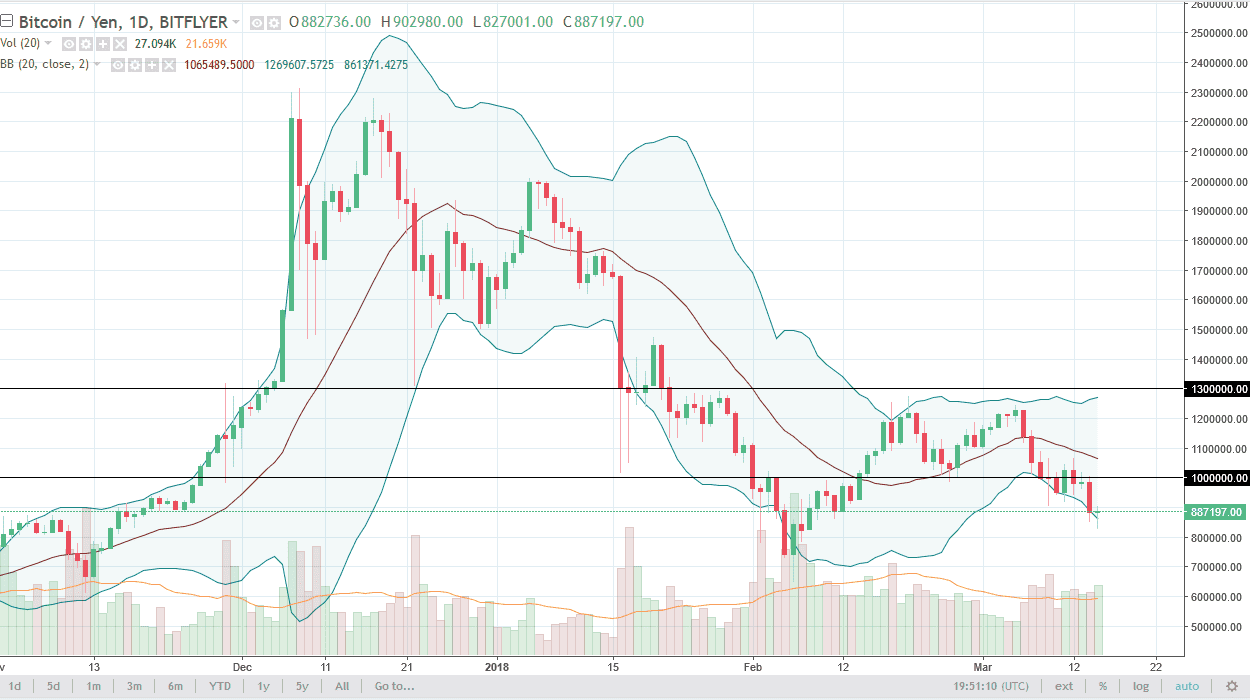
Bitcoin fell as well during the day, but turned around to form a hammer also, in the BTC/JPY pair. The Japanese yen is crucial when it comes to Bitcoin markets, because 40% of trading happens in Japan. The ¥1 million level above is going to be resistance, so it’s probably not until we break above the ¥1.1 million level that I would be interested in buying. Otherwise, we could break down below the hammer for the day, and that would be a very negative sign. At that point, I would anticipate that the market goes down to the ¥750,000 level, where breaking that would become a very negative sign. I believe that this is going to give us an opportunity to short the Bitcoin market against the yen at higher levels. However, things could be changing but right now it does not look as if we have the volume to make a massive change of attitude beyond some type of short bounce.


