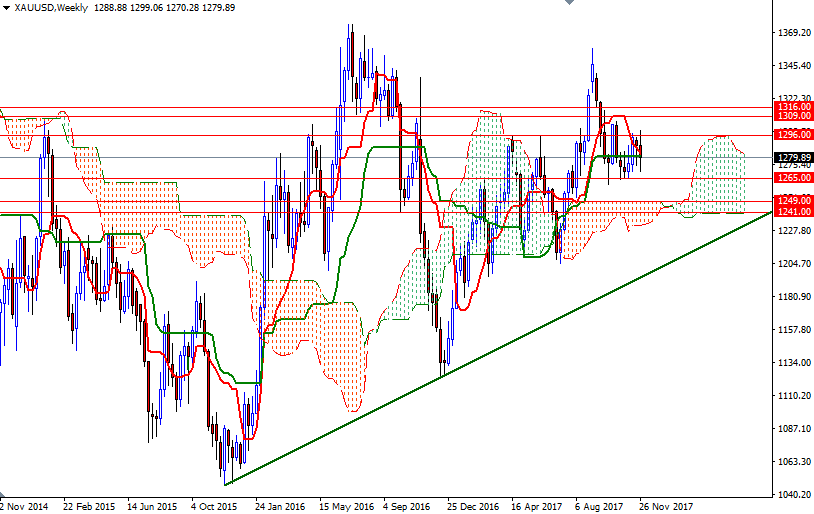
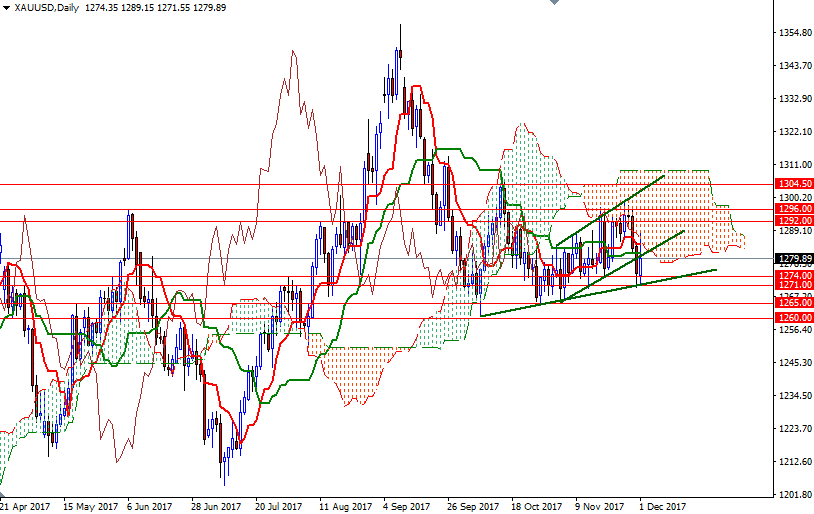
Gold prices settled at $1279.89 an ounce on Friday, suffering a loss of 0.69% on the week but making a gain of 0.32% over the month. XAU/USD tried to break through the resistance at $1296, which I had pointed out as a key to the $1304 level, earlier in the week but ultimately failed and began to crumble. As a result, prices dropped below the $1279.80-$1278.60 zone and tested the support in $1274-1271. The week offers a batch of news on the U.S. economy, headlined by the November Non-Farm Payroll report.
Gold prices continue to struggle as the year nearly comes to an end and the market remains stuck roughly between $1304 and $1260. The drop in physical demand has made the precious metal more sensitive to the dollar and stock markets. The U.S. Mint’s report shows gold coin sales so far this year are down more than 70% from this time last year. On the weekly chart, prices remain above the Ichimoku cloud, suggesting that prices will tend to rise over the long-term. The Chikou-span (closing price plotted 26 periods behind, brown line) which is above prices also supports this theory. However, XAU/USD is trading below the daily and the 4-hourly clouds and the Tenkan-sen (nine-period moving average, red line) and Kijun-sen (twenty six-period moving average, green line) are flat.
Down below, the 1274/1 area stands out a strategic support. The bears have to produce a daily close below 1271 to gather momentum for 1265 and 1260. A break below 1260 on a weekly basis implies that the market will be targeting 1249/7, the top of the weekly cloud. If the bulls are unable to defend this camp, expect a drop to 1241. To the upside, there is likely to be minor resistance at 1284.70, the daily Tenkan-sen, and then at 1288. If prices can hold above 1288, it is likely that the market will challenge 1296/2 next. Penetrating this barrier on a daily basis suggests the 1304.50 level will be the next port of call. A break through there would attract new buyers. In that case, look for further upside with 1309 and 1316/4 as next targets.


