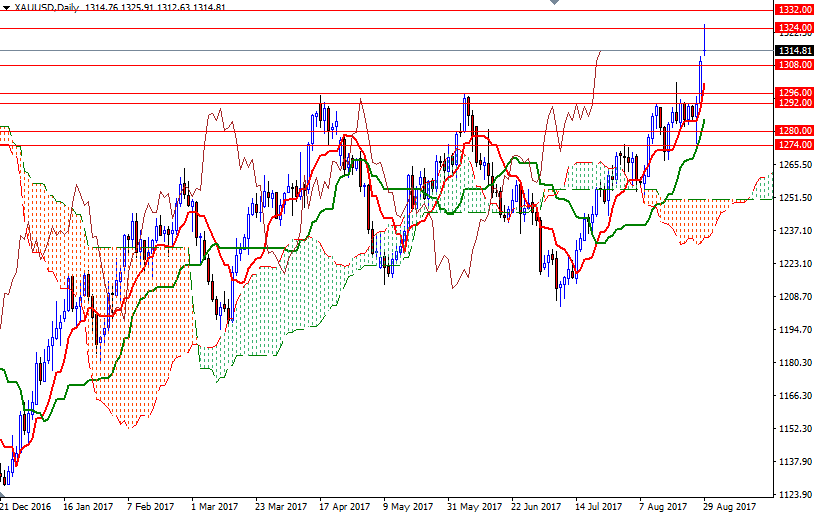
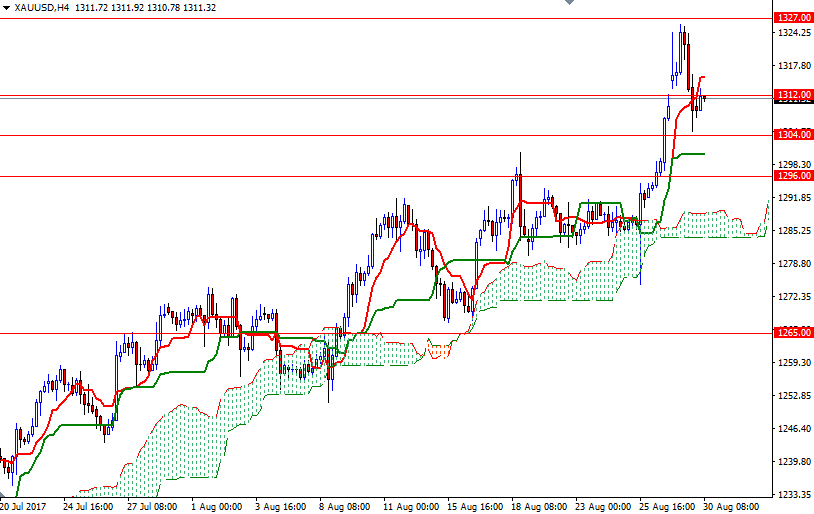
Gold fell on Tuesday after hitting a multi-month high in the session as some investors used this opportunity to take profit. XAU/USD not able to pass through the 1327.50-1324 area, and as a result, prices pulled back to test the support at $1304. In economic news, the Conference Board said its index of consumer confidence rose to 122.9 from 120.0 the prior month.
While world stock markets reversed some of the steep losses witnessed earlier in the day, gains in the dollar weighed on the precious metals. Investors are now looking to Friday's U.S. non-farm payrolls data. From a chart perspective, trading above the Ichimoku clouds suggests that gold is likely to maintain bullish trend over the medium term. However, the market may remain range-bound (between 1327.50-1324 and 1296-1292) ahead of the release of the August jobs report.
To the downside, the initial supports are located at 1308 and 1304. If the bears can push prices below 1304, then 1300 will be the next stop. A break down below 1300, where the Kijun-Sen (twenty six-period moving average, green line) sits on the H4 chart, indicates that the market will be targeting 1296. The bulls have to capture the nearby resistance at 1312 to make a move for the intra-day resistance at 1316, the Tenkan-Sen (nine-period moving average, red line) on the H4 chart. If XAU/USD can confidently pass through 1316, it is likely that it will proceed to 1320/19.


