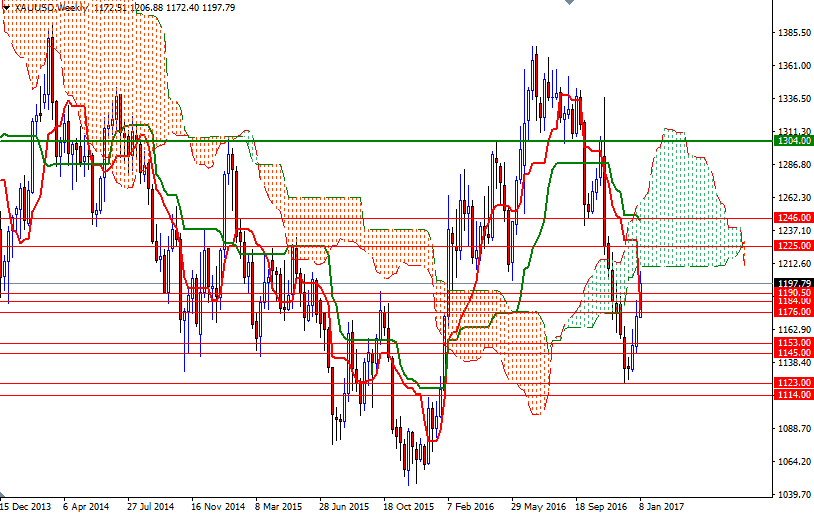
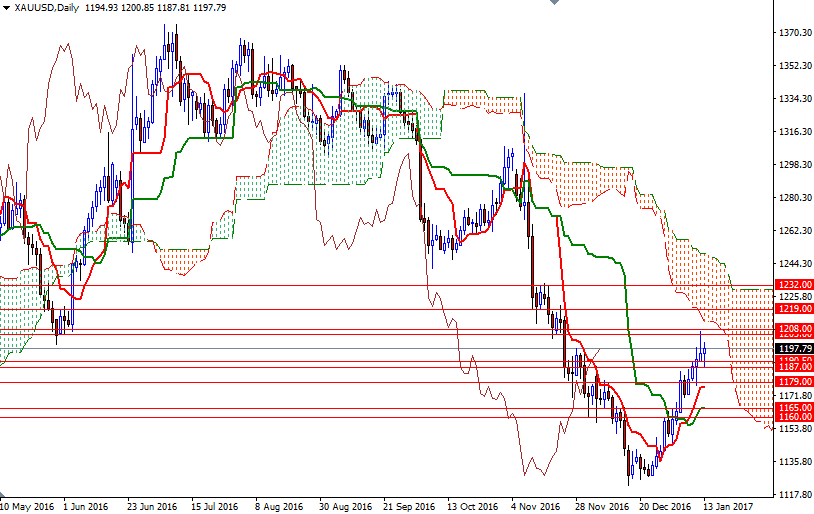
Gold ended the week up by 2.5% at $1197.79 an ounce, recoding a third consecutive weekly gain, as the American dollar’s weakness made gold more popular. The dollar bulls were disappointed by Trump’s lack of details on his economic stimulus plans. The dollar index slipped to the lowest levels since mid-December. Not surprisingly, the XAU/USD pair was able to reach the $1208/5 region after prices broke through the resistance at $1190.50. Gold has now rebounded 6.7% from a 10-1/2-month low of $1122.55 reached on December 15.
The latest data from the Commodity Futures Trading Commission (CFTC) showed that speculative traders on the Chicago Mercantile Exchange increased their net-long positions in gold to 109482 contracts, from 96550 a week earlier. On the 4-hour charts, XAU/USD resides above the Ichimoku cloud and the Tenkan-Sen (nine-period moving average, red line) and the Kijun-Sen (twenty six-period moving average, green line) lines are positively aligned. The Chikou-span (closing price plotted 26 periods behind, brown line) which is above prices also suggest that the bulls still have the near-term technical advantage. However, on the weekly and daily time frames, the Ichimoku clouds are on top of us and they overlap (roughly between 1212 and 1246). The clouds not only identify the trend but also define support and resistance zones. The thickness of the cloud is also relevant, as it is more difficult for prices to break through a thick cloud than a thin cloud. In other words, the market can go a bit further but there are pretty tough barriers ahead that could trigger a pull-back.
The initial resistance stands in the 1208/5 area, followed by 1213/2. If the XAU/USD pair manages to climb and hold above this region, we might see a push up to 1220/19. Clearing this barrier suggests that the market is getting ready to march towards 1225. A close beyond 1225 on a daily basis would make me think that 1232 might be the next target. To the downside, keep an eye on the 1190.50-1187 zone. If the market dives below 1187, then prices will probably fall to the 1179/6 area before finding some support. Closing below 1176 would open up the risk of a move towards 1172/1.


