S&P 500
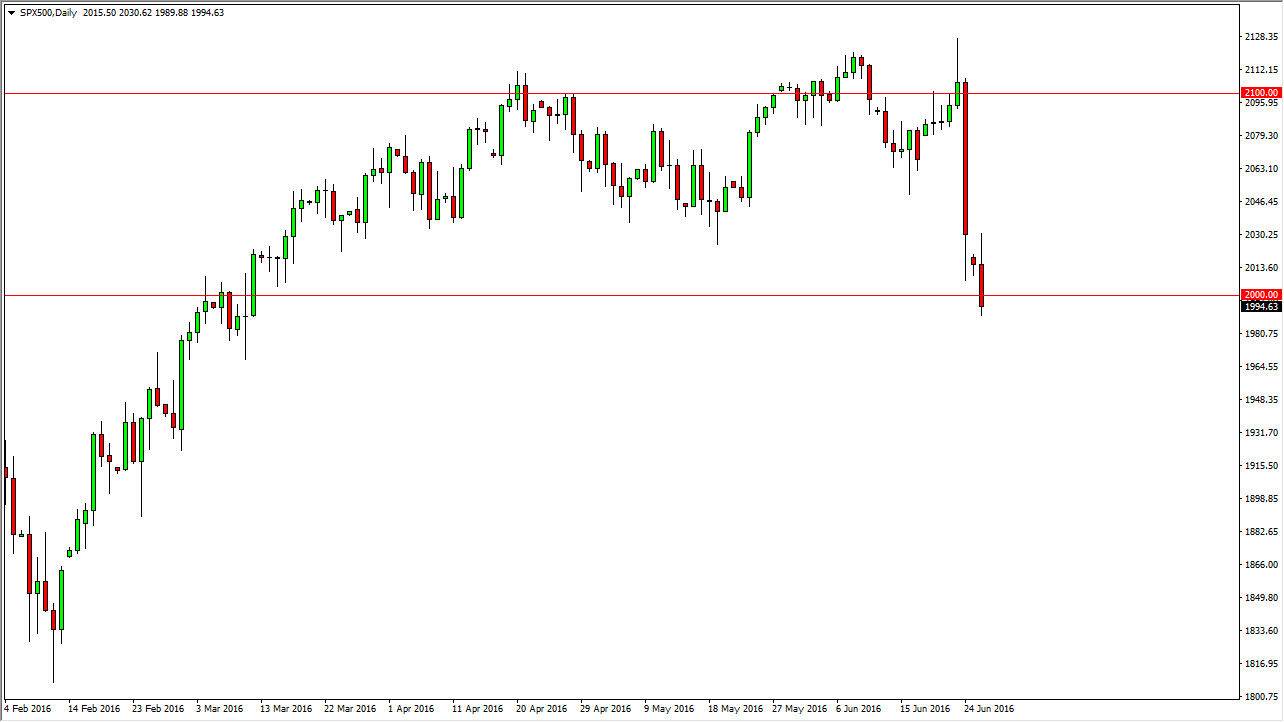
The S&P 500 initially gapped lower during the open on Monday, turned back around to fill that gap, and then fell below the 2000 level rather rapidly. This is a market that looks a very much under pressure at this point in time, and at this juncture I believe that the 1980 level is the bottom of the support that we are currently testing. If we can break down below there, the S&P 500 could unravel for the medium term. Nonetheless, the easiest trade I see is to simply look for selling opportunities after short-term buying opportunities as exhaustion will almost undoubtedly show itself from time to time. I have no interest in buying this market, and believe that the stock markets in general will be soft for a while.
NASDAQ 100
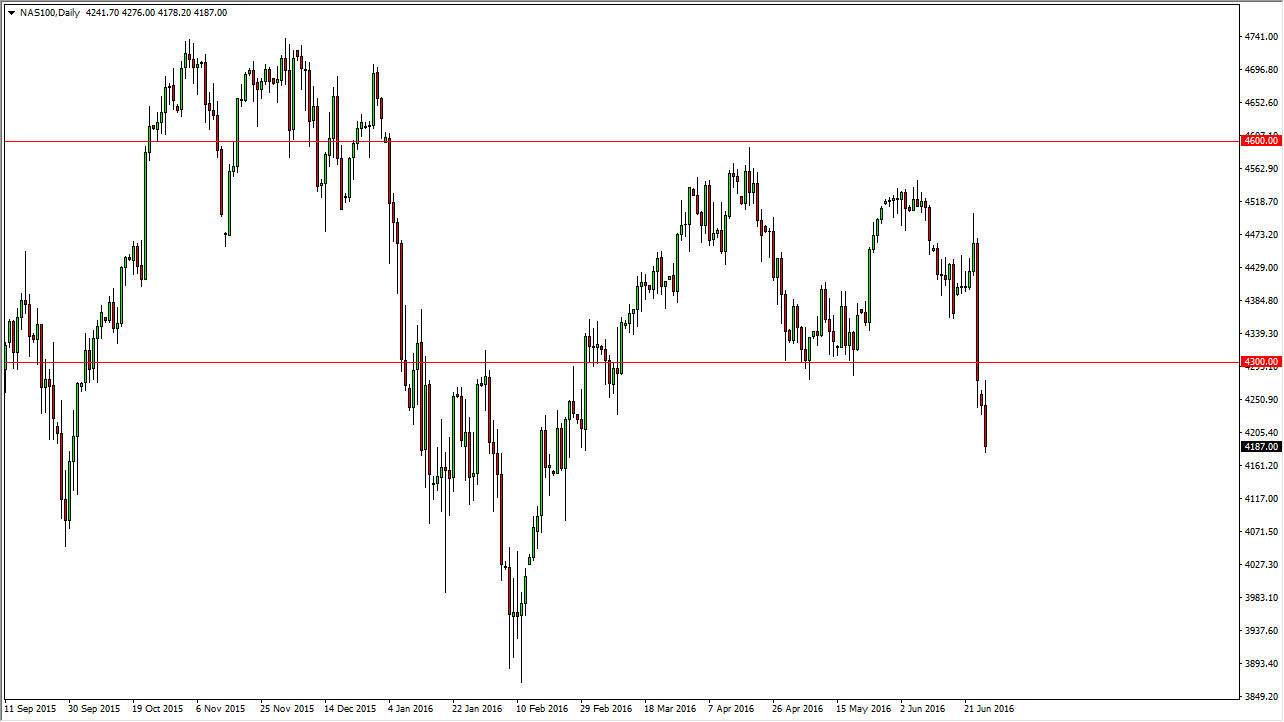
The NASDAQ 100 and gapped lower at the open on Monday as well, and even showed much more weakness than the S&P 500 did. Because of this, I believe that we are going to see a breakdown in the NASDAQ 100 much quicker than the S&P 500, and at this point in time I believe that the “ceiling” in this market is somewhere near the 4300 level. Is not until we break clearly above that and on a daily chart that I would even remotely consider buying this market, unless of course we get a longer-term “buy-and-hold” type of signal on the weekly chart. At this point in time, I believe it simply a matter of selling short-term rallies that show signs of exhaustion as we have plenty of uncertainty out in the marketplace, and that of course is very negative for financial markets in general. The NASDAQ 100 of course is going to be no different, and it should also be noted that the NASDAQ 100 tends to have much more exposure to Europe than the other US indices so therefore I feel this will be one of the worst performing ones.


