USD/JPY – Yesterday’s Trade Idea
I highlighted yesterday a potential short trade set-up on the USD/JPY currency pair. The idea was based upon waiting for the price to reach the level of 108.72 which is the 50% Fibonacci retracement of the recent strong downwards move.
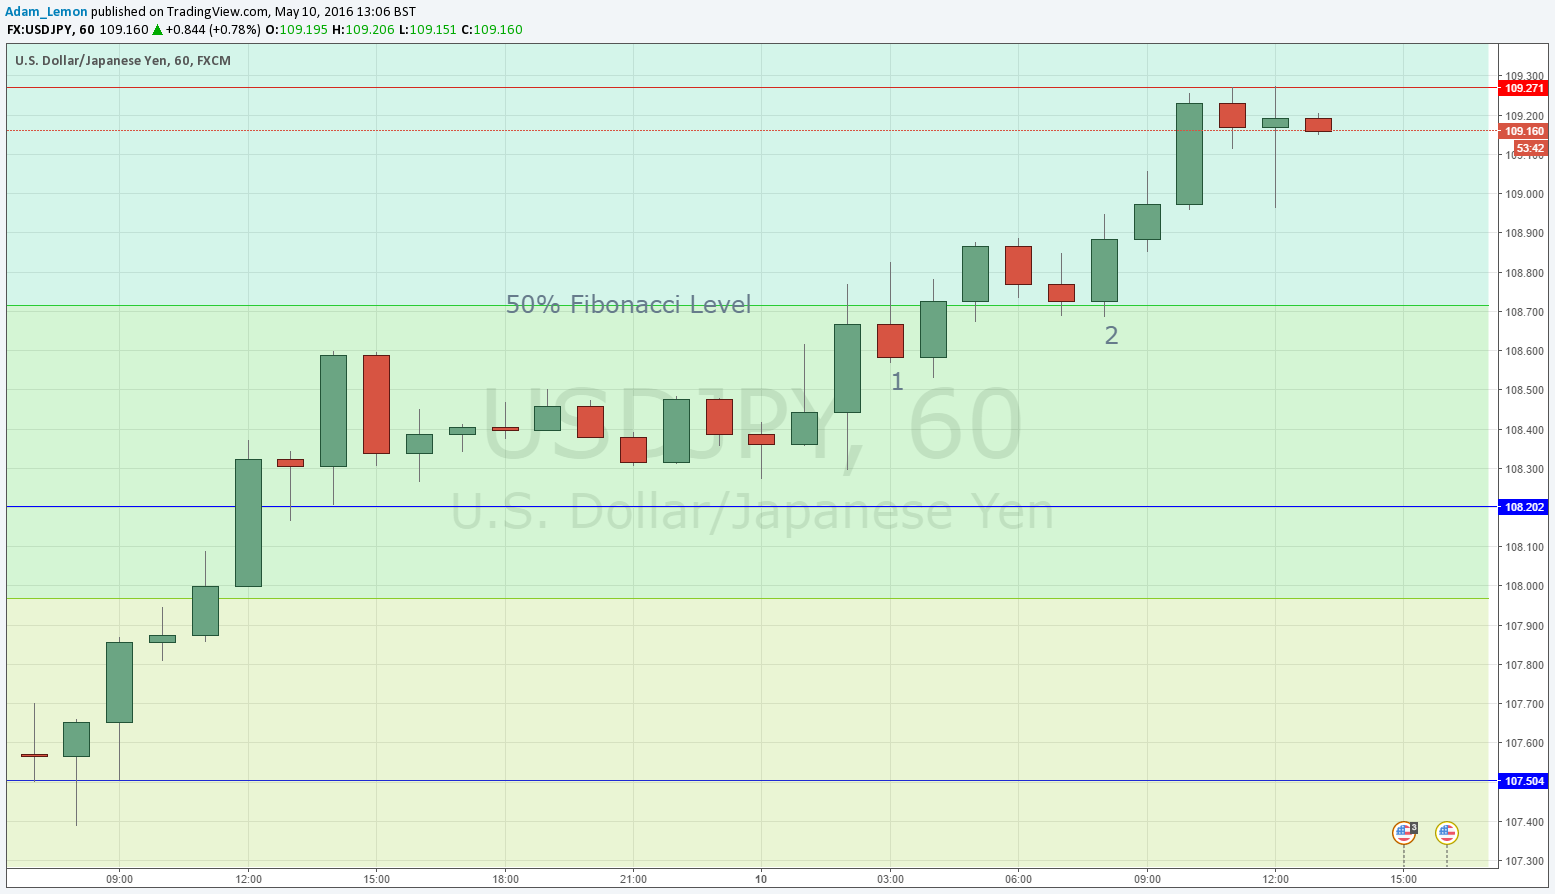
The price was reached during the previous Asian session, well before London opened. The action is shown in the H1 chart below:
When the price was hit, the first reaction was a bearish pin candle. Aggressive traders might have tried to go short just below that candle, marked by 1 in the chart.
It would have been a losing trade. More conservative traders that would have waited for greater confirmation of the short entry, such as another bearish candle, or even the close of the H4 candle on the next higher time frame, would not have found an entry, and avoided the loss.
This is a good illustration of how in trading, the harder you try to be early, the more losing trades you will suffer, but the larger the size of your winning trades will be.
Generally speaking, I believe that the best balance for newer traders is to use H4 candles for entries, as this time frame usually gets you into a new trade with enough confirmation, but also early enough. It is a trade-off (no pun intended)!
This is not the end of the story. Look at the candle marked by 2 in the chart. See how the level of 108.72 once broken started acting as support instead of resistance. It became the launching pad for the current upwards leg, which at the time of writing is being capped by resistance at 109.27.
This goes to show that the level of 108.72 did have some significance. It is always possible to identify these levels, but far harder to predict how the price will behave if and when such a level was reached. In this case, the bullish sentiment on this pair was just too great for the price to turn at 108.72.
Context is all-important.
If the price falls soon back down to the 108.72 level, it might act as support again, and should be a level worth watching.

