S&P 500
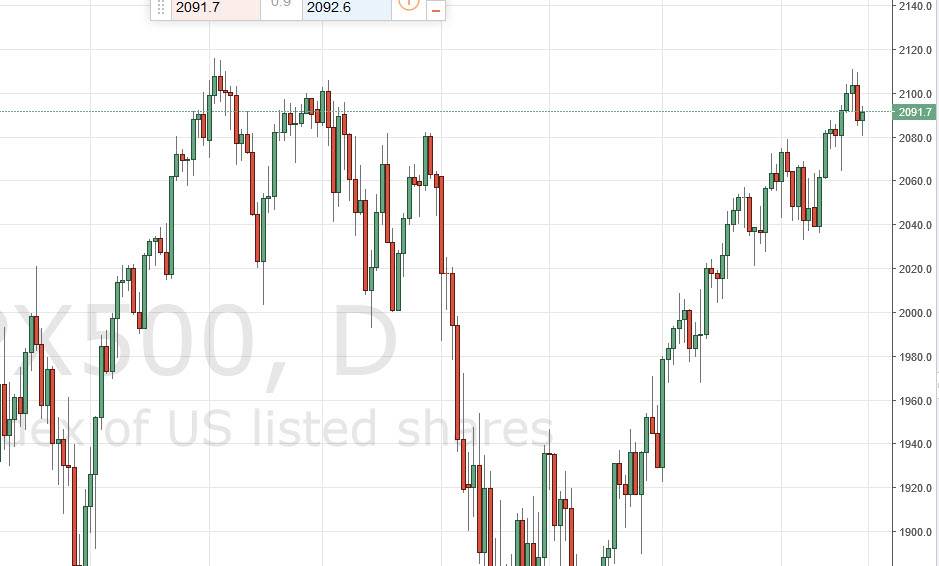
The S&P 500 initially fell during the course of the session on Friday, testing the 2080 handle. We did find enough support down there to turn things around and form a hammer though, so it looks like we are continuing to see buying pressure below, and that buyers are most certainly likely to continue to go higher. However, there’s a lot of resistance just above, so at this point in time it is probably going to be very difficult to get higher. It doesn’t mean that we won’t, just that it’s going to be a lot of volatility between here and the breakout.
If we do break down from here, I think that the 2060 level is going to be supportive as well as the 2040 level. Given enough time though, this market may have to pull back a little bit to find more momentum as we have certainly exploded to the upside in it seems like we may be running out of momentum for the moment.
NASDAQ 100
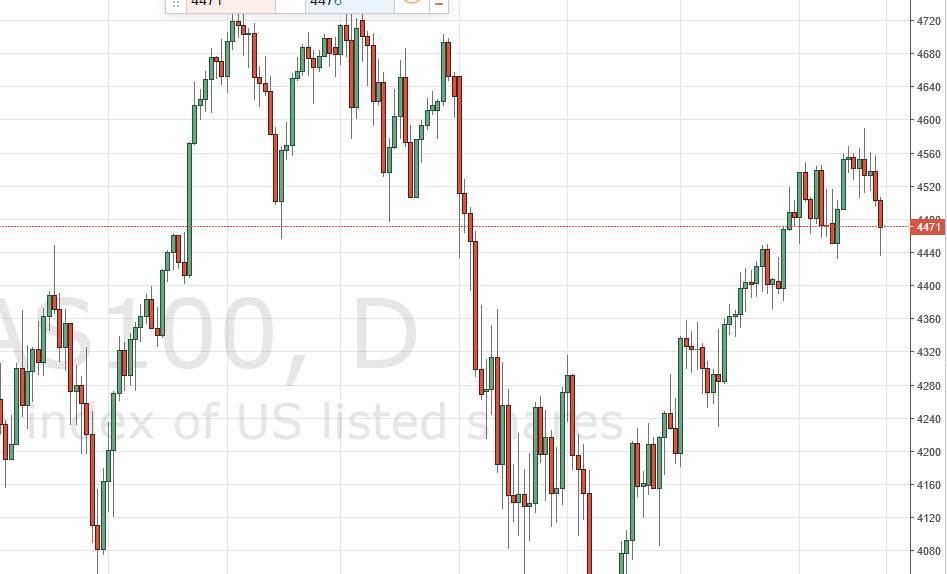
The NASDAQ 100 initially fell during the course of the day but tested the 4440 level and found quite a bit of support, causing the market to turn back around and form a hammer. With that, the market could very well continue to grind higher, and at this point I would have to say that it looks like we are consolidating between the 4440 level on the bottom, and the 4560 level on the top. I’m not saying that we can break down below there or above there, just that it looks like we are currently stagnating in this general vicinity.
Above the consolidation area though, there is a lot of noise between there and the 4725 level, which is my longer-term target. With this being the case, I believe that we will continue to see buyers again and again on short-term pullbacks, but nonetheless we are going to have quite a bit of volatility regardless.


