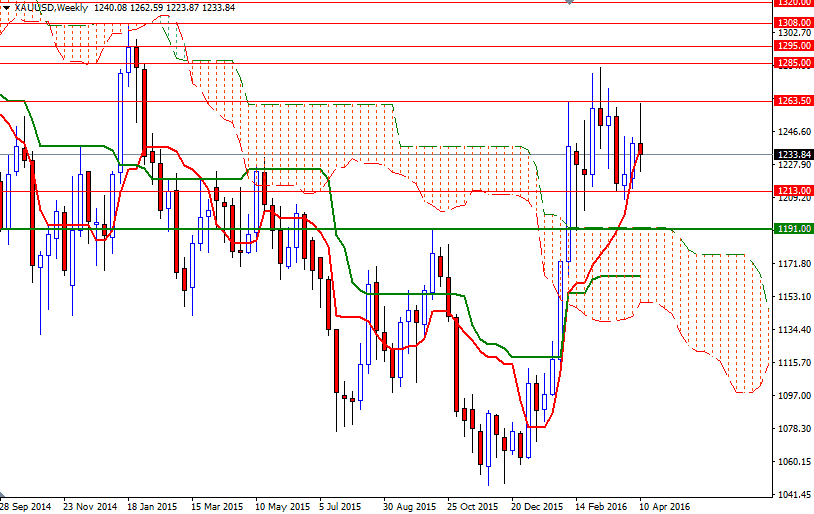
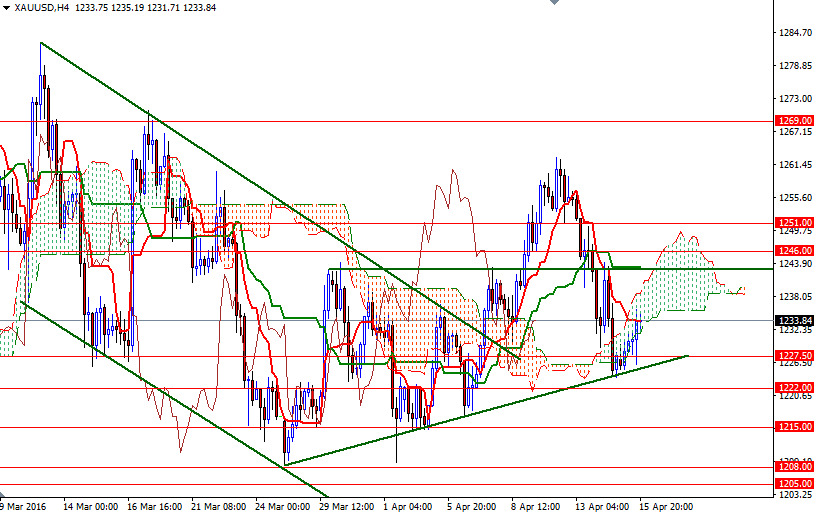
Gold prices settled at $1233.84 an ounce on Friday, suffering a loss of $6.24 on the week, as a recovery in investor risk appetite dented the precious metal's appeal. The XAU/USD pair initially rallied, hitting a 3-week high of $1262.59, but failing to break through the resistance in the 1263.50-1258.60 area put pressure on the market. As a result, prices broke down and returned to a short term bullish trend line which was sitting in the 1227.50-1222 zone. This trend line indeed gave a bounce up as expected but it wasn't enough to penetrate the Ichimoku clouds on the 1-hour chart.
It appears that the equity market remains more attractive and because of that investors demonstrate limited interest in gold. For quite some time, gold has maintained an inverse relationship with stocks, so I think the performance of the major equity markets will likely continue to influence the price of gold. Technically, trading above the Ichimoku clouds on both the weekly and daily charts gives the bulls an advantage over the medium-term but the tall upper shadow of the weekly candle argues for rejection of higher prices.
In other words, XAU/USD may spend some more time within this recent consolidation area between the 1263 and 1213 levels. To the upside, the initial resistance stands in the 1239-1235.75 area where the hourly and 4-hourly Ichimoku clouds overlap. Climbing above this barrier would allow the market to tackle the subsequent targets at 1243 and 1246. If XAU/USD can close above 1246 on a daily basis, prices will have a tendency to approach 1263.50-1258.60 again. On its way up, the 1151 level may act as a speed bump. On the other hand, if the bears come back into play and manage to drag prices below the 1227.50-1222 support, then the market could collapse to 1215/3 region. Since breaking below 1213 convincingly may turn this consolidation into liquidation, look for further downside with 1208/5 and 1199/7 as targets.


