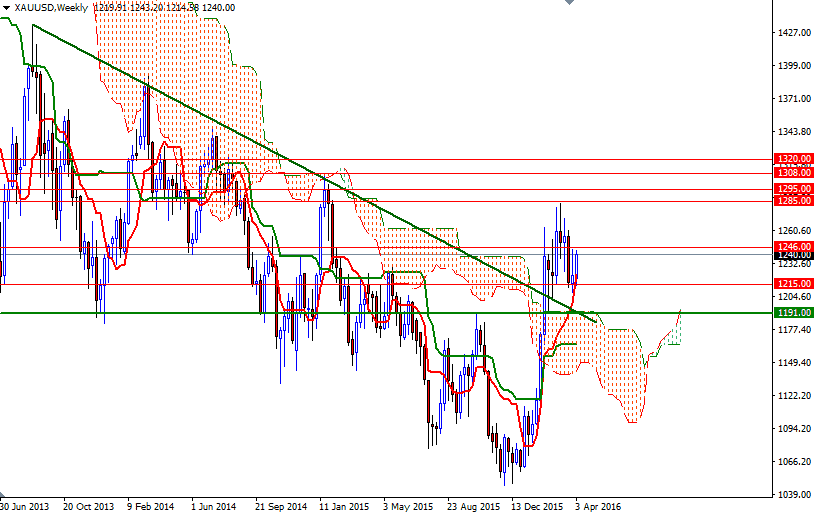
Gold prices settled at $1240 an ounce on Friday, scoring a gain of 1.6% on the week, as soft global economic data, the Federal Reserve's cautious stance towards hiking interest rates and a slide in equities lured investors back into the market. Expectations the Fed will deliver its second rate hike in April faded after the release of the FOMC minutes. "Several expressed the view that a cautious approach to raising rates would be prudent or noted their concern that raising the target range as soon as April would signal a sense of urgency they did not think appropriate," the records showed. Now, most people anticipate that policymakers will leave the policy unchanged at its April 26-27 meeting and make their next move in June.
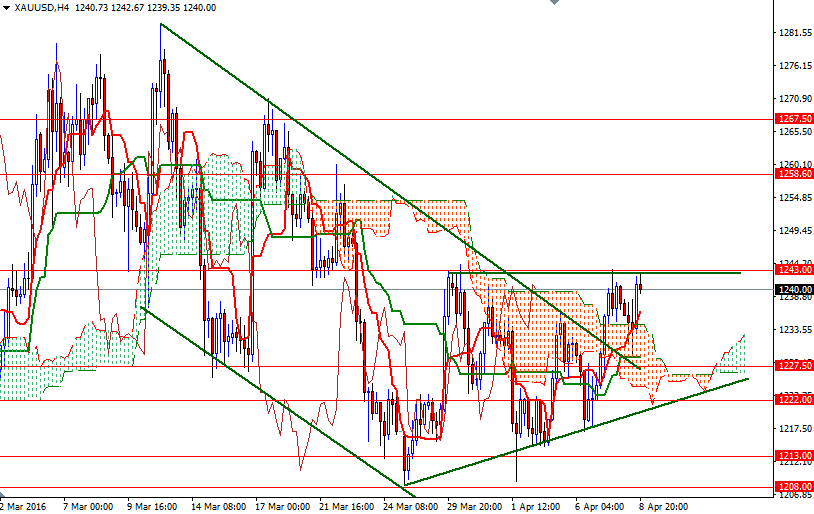
Friday's data from the Commodity Futures Trading Commission (CFTC) showed that speculative traders on the Chicago Mercantile Exchange increased their net-long positions in gold to 190400 contracts, from 189806 a week earlier. Lately, there have been some changes to the technical picture for gold. The short-term bearish trend line that has been creating a constant pressure on the market is broken and prices climbed back above the Ichimoku clouds on the 4-hour time frame. Basically, the overall trend is up when prices are above the cloud, down when prices are below the cloud and flat when they are in the cloud itself. However, we can also see an ascending triangle forming on the 4-hour chart.
With these in mind, I think penetrating the 1246/3 resistance is essential for a bullish continuation. In that case, XAU/USD may proceed to the 1255-1258.60 area. Beyond that, the bears will be waiting in the 1272-1267.50 region. The bulls will have to capture this strategic camp if they intend to challenge the bears on the 1285/0 battlefield. On the other hand, if the market finds the aforementioned area (1246/3) too resistive to conquer, then the bears will probably try to drag prices towards the lower line of the triangle. Falling through this support could pull the market back to the 1215/3 region. Closing below 1213 would indicate that the bears will be aiming for 1208 (or perhaps 1199/7) next.


