Gold ended the holiday-shortened week down by 3.5% at $1217 an ounce as the possibility of an earlier-than expected rise in U.S. interest rates weighed on the market. Comments from St. Louis Fed President James Bullard and Chicago Fed President Charles Evans revived views that the Federal Reserve might consider edging the policy rate towards more normal levels at its next meeting. Increasing demand for the greenback and the risk on attitude across global markets tend to weaken the appeal of commodities such as gold. A report from the Commerce Department on Friday, when the market was closed for Good Friday, showed gross domestic product rose at a 1.4% annual rate instead of the previously reported 1%.
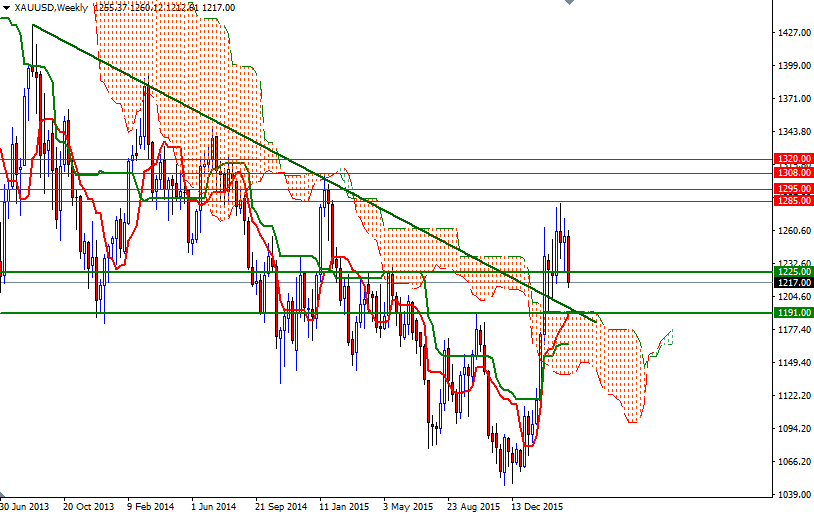
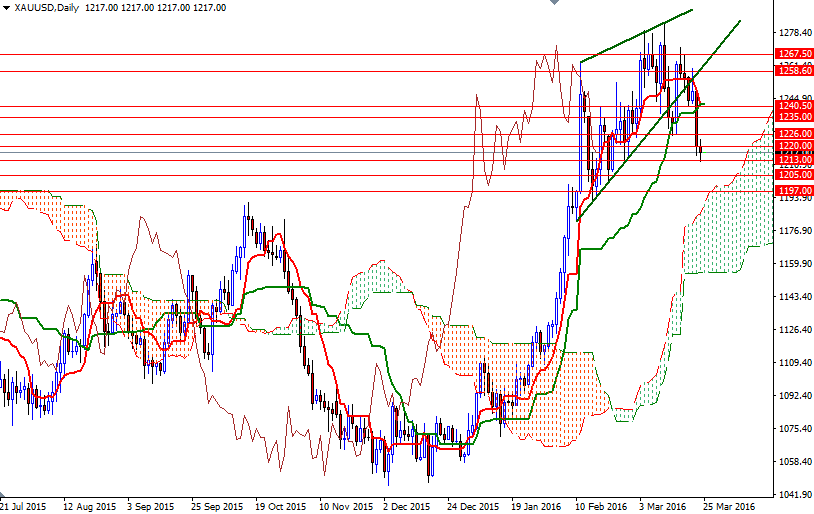
The U.S. non-farm payrolls and inflation data this week will be in focus as investors try to gauge the health of the economy. Federal Reserve officials have long stressed that their decision will depend on how the economy evolves. Technically speaking, the weekly and daily charts remain bullish while the XAU/USD pair is trading above the Ichimoku cloud. The 4-hourly chart, however, tells a different story. The market is beneath the cloud and the Chikou-span (closing price plotted 26 periods behind, brown line) dropped through prices. In addition, there are negatively aligned Tenkan-Sen (nine-period moving average, red line) and Kijun-Sen (twenty six-period moving average, green line) lines on both the daily and 4-hourly charts.
With these in mind, I will keep an eye on the 1213 and 1226 levels. If the market dives below the 1213 level, then I think the market will have a tendency to fall further towards the daily cloud (1199/7). Closing below 1197 would indicate that XAU/USD is getting ready to visit the support at 1191/89. Note that the clouds on the weekly and daily charts overlap (the area between 1191 and 1168). This area should provide powerful support if prices return there. On the other hand, it is possible to see the XAU/USD pair challenging the 1230 and 1235 levels if the bulls can defend their ground and move beyond the 1226 resistance zone. I think clearing the resistance in the 1243-1240.50 zone is essential if the bulls want to win the battle and improve the short-term technical picture. In that case, the market will be aiming for 1248.


