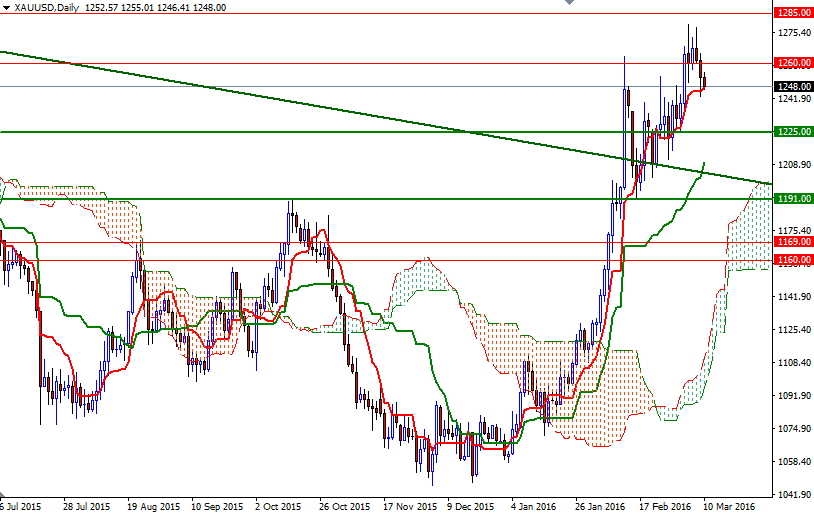
Gold prices fell $8.42 an ounce yesterday, down for the second straight session to $1252.85, as expectations of further easing from the European Central Bank prompted some investors to take profits. The precious metal touched $1279.76 last week, its highest since Feb. 3, 2015, supported by growing perception that the U.S. Federal Reserve will not raise interest rates at its March 15-16 policy meeting. Technical selling was also behind gold's 0.64% drop on Wednesday. Not surprisingly, the bulls' failure to maintain prices above the 1262/0 area put some extra pressure on the market.
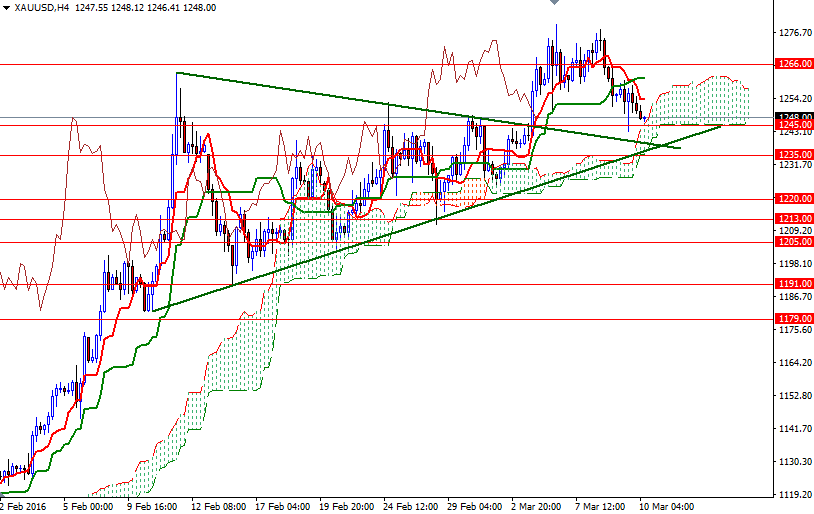
The XAU/USD pair is trading at 1247.75, lower than the opening price of 1252.57 and it appears that the support at the 1245 level will be tested. From a technical point of view, the medium-term directional bias remains bullish, with the market trading above the weekly and daily Ichimoku clouds. However, if the ECB meets expectations (and drive stocks up), the euro should weaken and the greenback should strengthen.
In that case, the market may fall through 1245 and retreat to the 1238/5 area. If this support is broken, then the 1225 level will probably be the next stop. Closing below 1225 would suggest that the bears are getting ready to tackle 1220 (or even 1213). To the upside, the initial resistance stands in the 1260-1261.72, where the Kijun-Sen (twenty six-period moving average, green line) sits on the 4-hour chart. The bulls will have to push prices beyond that so that they can test 1266. If prices climb back above 1266, it is likely that the market will proceed to 1280/79.


