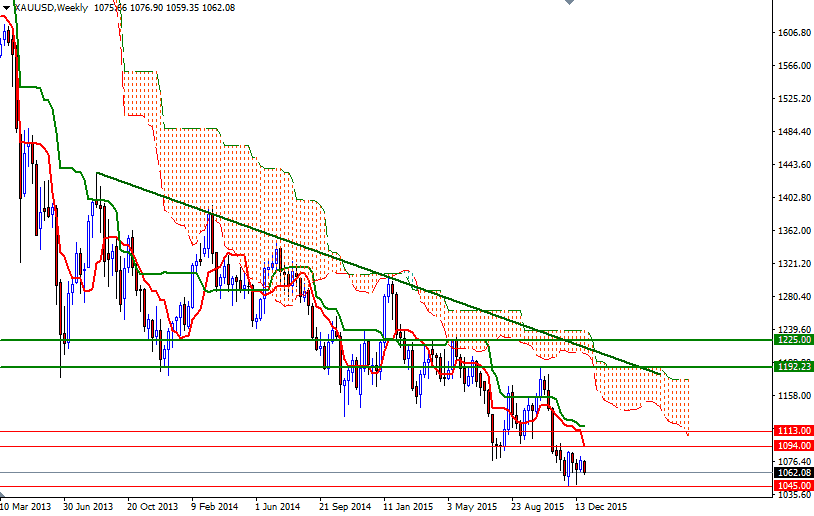
Gold prices dropped nearly 10.5% this year as market players flocked to the greenback on prospects for higher U.S. borrowing costs. Persistent uptrend in equities markets and concerns about Chinese growth (China accounts for almost a quarter of global gold demand) also contributed further pressure on gold. Although the XAU/USD pair initially tried to rally, prices have been falling since the market peaked at $1307.47 in mid-January. Since then, despite wild stock market gyrations and flare-ups in geopolitical concerns, the precious metal bucked its apparent safe-haven appeal.
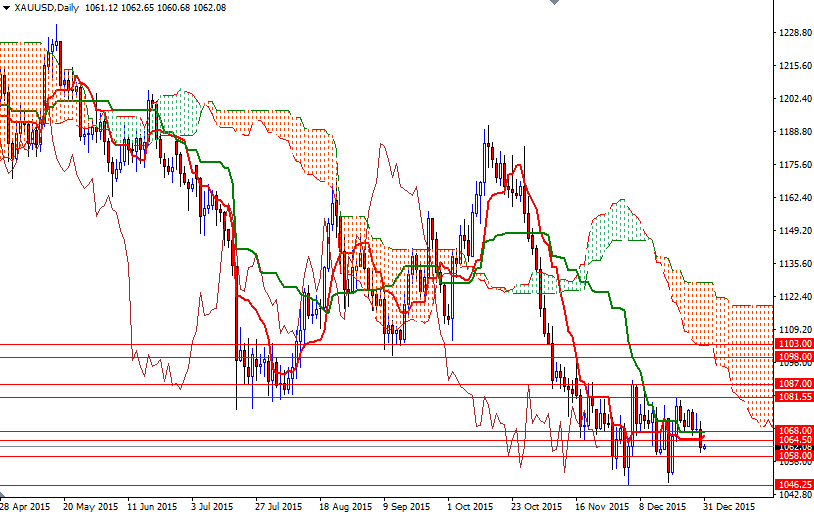
The metal’s drop to a six-year low lured some investors back into the market but the belief that the dollar is in the midst of a strong rally and the Federal Reserve will continue raising rates in 2016 weighs on the market. A prolonged era of low oil prices could reduce the investment appeal of bullion as well because a part of the demand comes from inflationary expectations. Speaking strictly based on the charts, I think there are two things to pay close attention. First of all, the XAU/USD pair is trading below the weekly and daily Ichimoku clouds, suggesting that higher prices will continue to attract sellers in the long-term. This idea is also supported by the descending trend-line which coincides with the weekly cloud. The next thing is the bottom formed around the 1045 level and the fact that the market spent the last eight week in the area roughly between the 1094 and 1045 levels.
Although the long-term outlook still points to a downwards bias, the short-term picture is unclear and will likely depend on the direction prices will exit. In order to extend gains and test the 1098/4 region, the bulls will have to push through 1081.55 and then 1089/7. Beyond that, the bears will be waiting at 1103 and 1113. Closing above 1113 on a weekly basis could pave the way towards 1160/40. To the downside, there are minor supports at 1058 and 1053. If the 1053 level gives way, XAU/USD will probably test the crucial 1046.25 - 1045 support afterwards. Eliminating this support would open up the risk of a move towards the 1017/5 zone. On its way down, expect to see some support at 1025.


