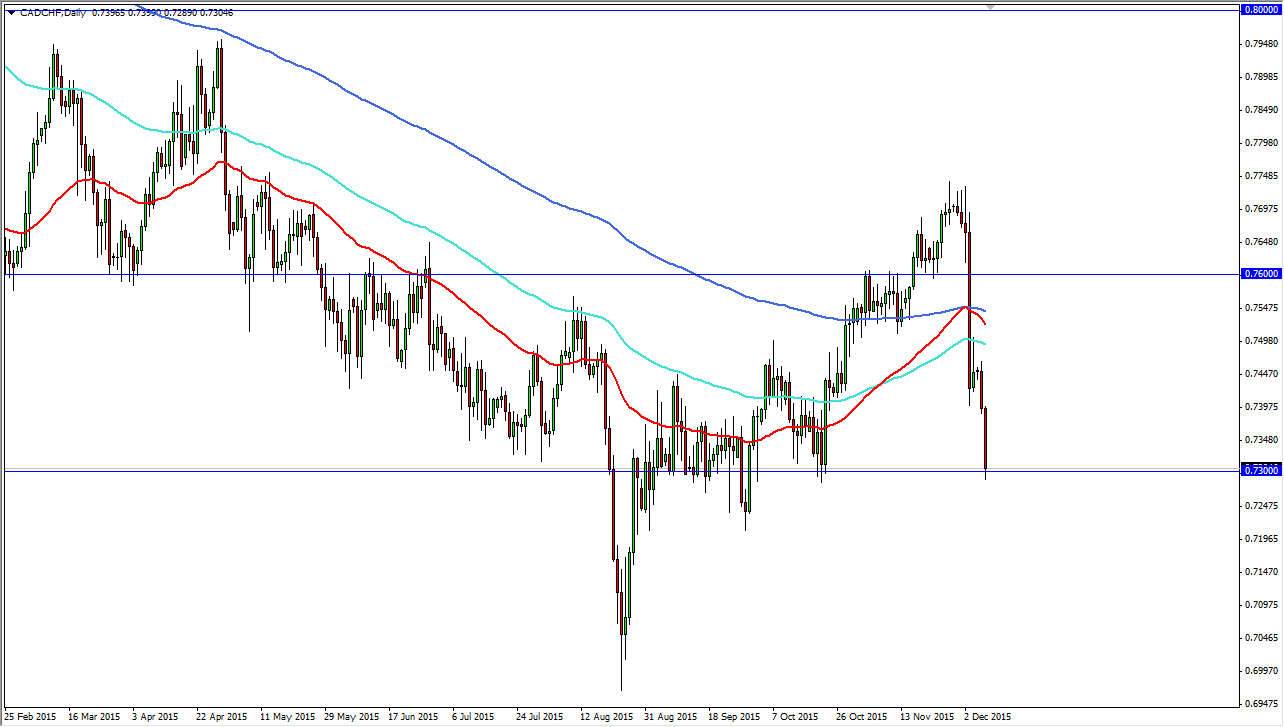
During the session on Tuesday, the CAD/CHF pair fell yet again as the bearish pressure on the Canadian dollar continues. I find this particularly interesting as this pair features the Canadian dollar against the Swiss franc, and the Swiss franc looks soft against almost everything else. Ultimately, I think the Swiss franc is being punished overall due to the fact that the Swiss are so heavily reliant upon the European Union economy to sell exports. The fact that we are following in this pair so drastically shows just how bad the situation is for the Canadian dollar as oil markets continue to fall apart.
Remember, the Canadian dollar is essentially a proxy for the price of oil, and now that we have broken down to fresh lows again, it makes sense that the Loonie will continue to be punished in the Forex markets, even against a currency as lowly as the Swiss franc.
Several Indicators Pointing Lower
As you can see on this chart, I have 3 moving averages plotted. The dark blue moving average is the 200 day exponential moving average, while the turquoise one is the 100 day exponential moving average, and finally the red line is the 50 day exponential moving average. These are the 3 most common moving averages that longer-term traders pay attention to, and although the 50 day crossed over the 100 day moving average a while ago, it could not cross above the 200 day moving average, and therefore it looks as if the downward momentum has won yet again. All 3 moving averages are pointing lower, and that of course is a very negative sign.
The 0.73 level is massively supportive, but as we sit right on it, and closed towards the bottom of the range, it normally means that we will eventually break down. A bounce from here would not be overly surprising due to the fact that this area has been reliable and of course we fell drastically. However, that rally should only end up being a selling opportunity on signs of exhaustion. On a move below the 0.7250 level, I would be willing to sell as well.

