Gold prices climbed 1.6% since the beginning of the month, supported by escalating tensions between the West and Russia over Ukraine. Last week, the prospect of further sanctions on Russia stirred concerns and lifted the XAU/USD pair back above $1300 an ounce after the market touched its lowest levels since February 10. Although the fear factor caused some investors to ignore a series of upbeat economic reports out of the United States and move to the safety of gold, majority of market players are not in a panic mode and this is affecting the price action. But if investors start to shift money from equities to gold, the overall outlook might change.
Aside from the improving U.S. economic data and perception that the Ukrainian situation still can be resolved diplomatically, I think weakening Chinese economy might weigh on the shiny metal as well. Since Chinese gold consumption plays an important role in this market, gloomy numbers out of China could limit potential gains.
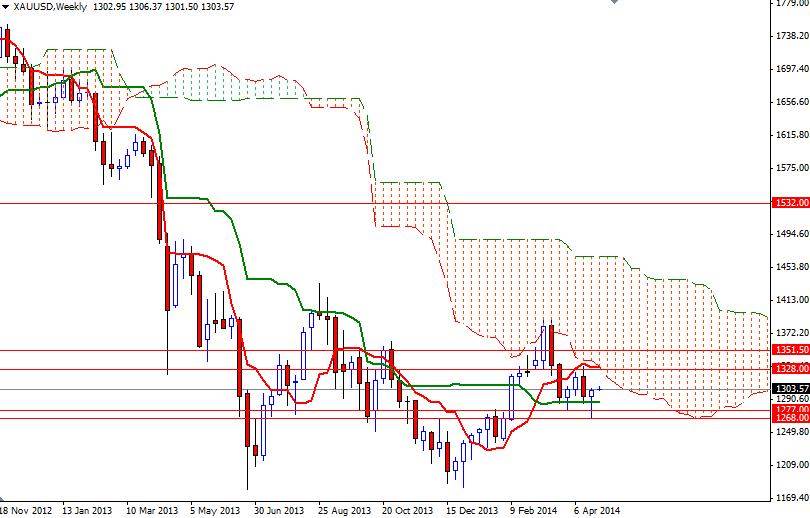
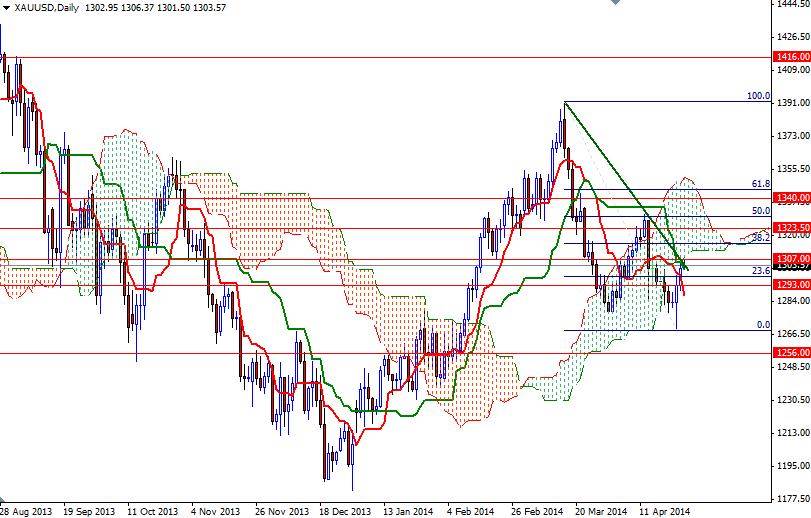
Another factor which makes me think that the gains will be limited is the location of the Ichimoku clouds on the weekly and daily charts. Technically speaking, the thicker the Ichimoku cloud, the less likely it is that prices will manage a sustained break through it. The XAU/USD pair has been trading below the cloud (weekly chart) since early 2013 but what catches my attention most is the market's trading range in the past 11 months. As you can see from the charts, gold prices are trapped roughly between the 1180 and 1430 levels for almost one year.
The first hurdle gold needs to jump is located around the 1307 level but I think the 1328 resistance is going to be crucial going forward. This area has been both resistive and supportive in the past, so breaking through this barrier is essential for a bullish continuation. If the bulls push and hold the market above the Ichimoku clouds on the daily chart, they could have a chance to tackle the 1351.50 resistance level. Closing above this level would more investors back to the market and increase the possibility of a new attempt to revisit the 1366 - 1370 resistance area. However, if gold prices drop below the 1285/1 support level, we might see prices falling back to 1277. The bears will have to capture the 1268 support level in order to increase their strength and start a journey towards 1256.


