Our last analysis one week ago contained the following predictions that were relevant to subsequent developments:
1. Today will probably be a down day
2. The area from 1.0470 to 1.0500 should hold as resistance
3. Conservative longs can be taken around 1.0400 – 1.0425 will profits taken or protected very close to 1.0470
4. Bullish reversals off recent daily lows before 1.0339 could also be good long trades
5. Open long trades should have profits taken or locked in now
6. The uptrend is intact
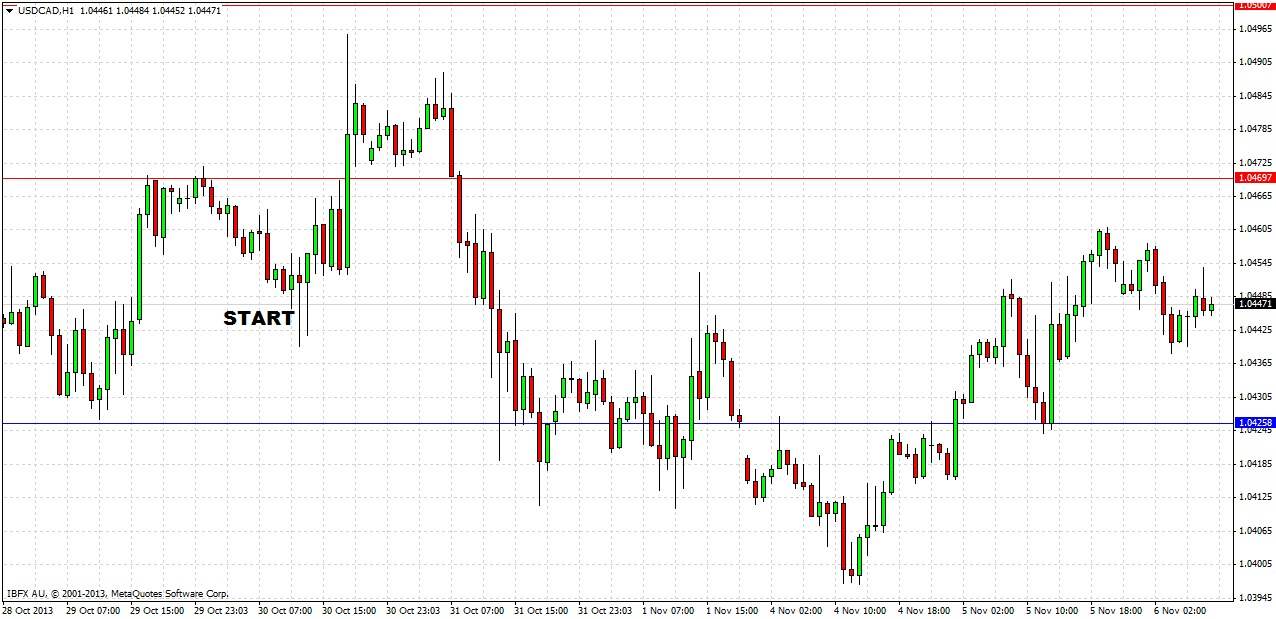
Let's look at the 1 hour chart since then to see how things turned out:
The prediction worked out extremely well overall, and produced profitable trades:
1. We were wrong about the down day.
2. The area from 1.0470 to 1.0500 did hold as resistance, and has not been reached since.
3. Taking longs between 1.0400 and 1.0425 would have worked perfectly, the lowest price during the previous week was 1.0397, so that is only a 3 pip draw down from the stated entry zone. We recommend taking or locking in profits now if you have not already done so on any long trades from here.
4. The bullish reversal outside bar on the morning of 4th November would have been an excellent “bullish reversal off recent daily low” trade, and would have given a maximum reward to risk so far of about 7 to 1.
5. Recommending closing longs was seemingly wise advice, as the price reached highs on the day of the prediction that it has not revisited since.
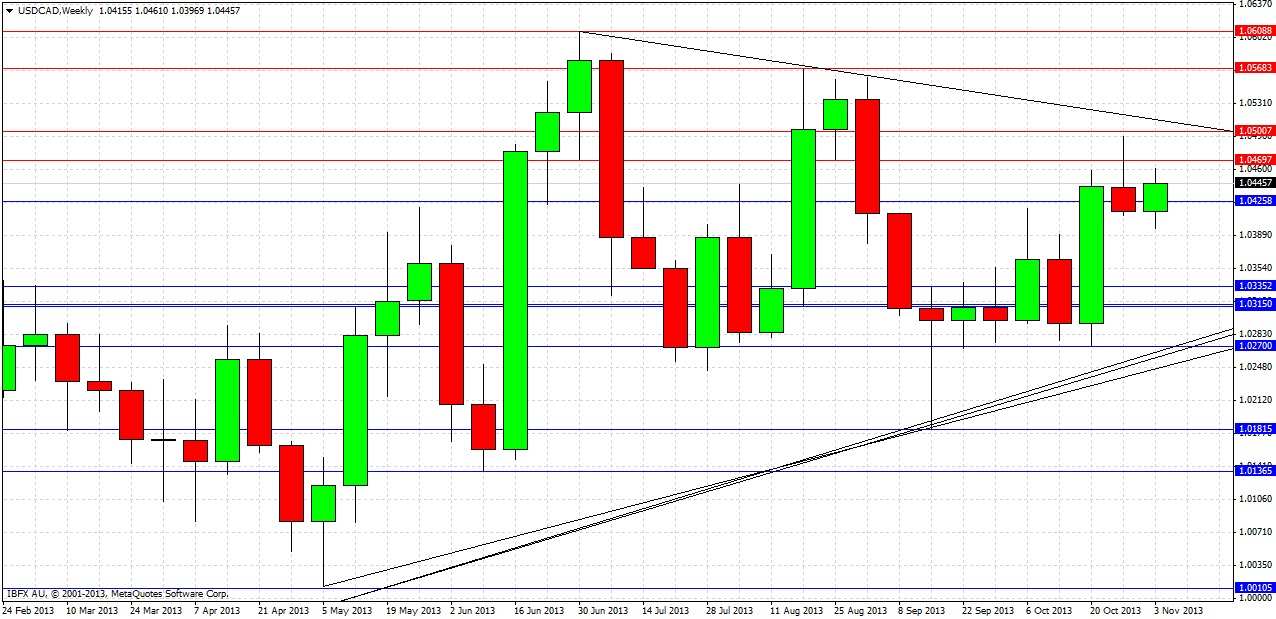
Turning to the future, let's start by taking a look at the weekly chart:
Last week printed a bearish pin bar off a fairly strong resistance zone. The uptrend remains intact but has not been able to make significant new highs in recent weeks. In fact we can draw an upper triangle edge trend line, which will shortly coincide with the resistance zone below 1.0500 during the next few days. How the price will behave at this trend line should lend some clues as to the health of the uptrend, although of course the higher lows are more significant than any lower highs.
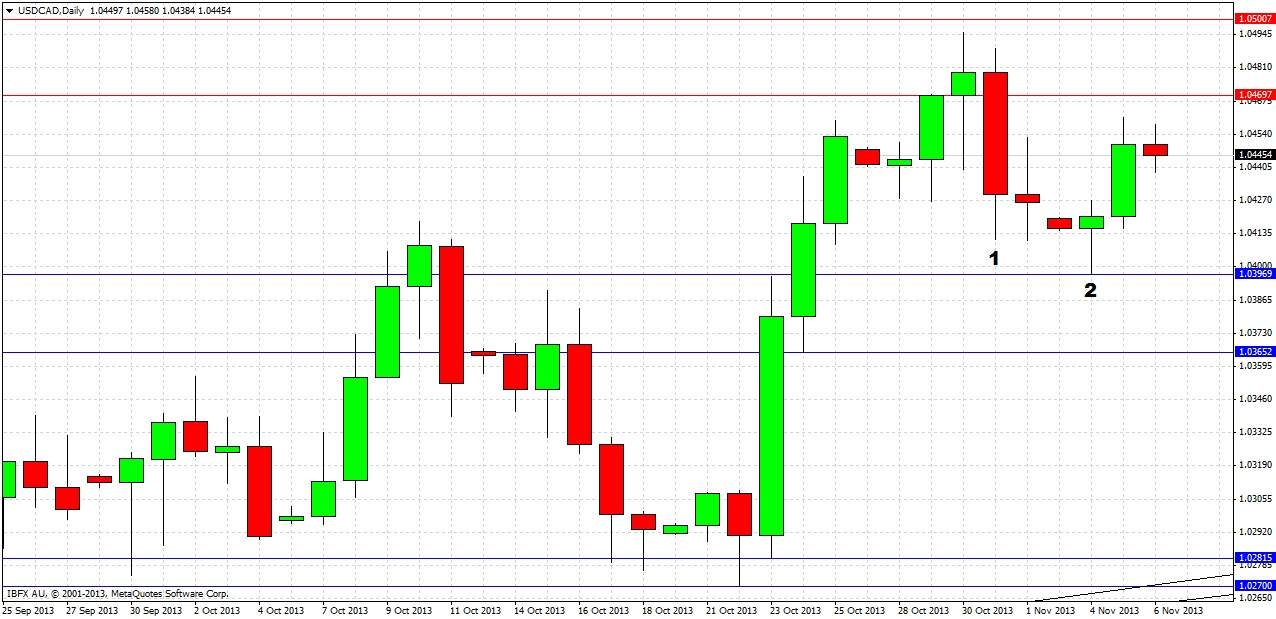
Let’s take a closer look now with the daily chart:
Last Thursday printed a bearish reversal candle, marked at (1), but it showed some weakness by leaving some wick at its low. Monday broke Friday’s inside candle, printing a small bullish pin bar marked at (2), making a swing low just below 1.0400. This level is significant, being both a round number and very close to the high of the wide-bodied bullish reversal candle that can be seen to the left the last time price was at this level. The price has not been able to get back to 1.0470 yet, or break yesterday’s high.
Our summary and forecasts are as follows:
1. The uptrend remains intact.
2. There is strong resistance from 1.0470 to 1.0500.
3. There is support that may prove to be quite strong at 1.0400.
4. A bearish trend line can be drawn off swing highs in June and August; in a few days the line will reach the 1.0500 and continue to descend and could act as additional resistance.
5. Short touch trade recommended off 1.0500 during the London and NY sessions if this is reached before 1.0400 is retested.
6. Long trade recommended off bullish reversal bars touching 1.0400 on the 1 hour chart during London and NY sessions.
7. If the 1.0365 level is broken to the downside soon, this calls the uptrend into question and the price should fall to the bullish trend lines and/or the 1.0281 level, whichever is higher, where it should bounce. This would be a good zone to look for a long trade.
8. If the price makes a sustained break and closes above 1.0500 and the upper triangle trend line, this would be a very bullish sign and the price should then go on to reach 1.0565.


