Last Thursday's piece ended with the following predictions that have been relevant to the price action that has taken place since then:
1. Still overall bearish bias, but momentum may slow.
2. 1.6000 may hold for a time.
3. A sustained break below 1.6000 will see the price fall to 1.5900.
4. Weak support at 1.6000, strong support at 1.5890.
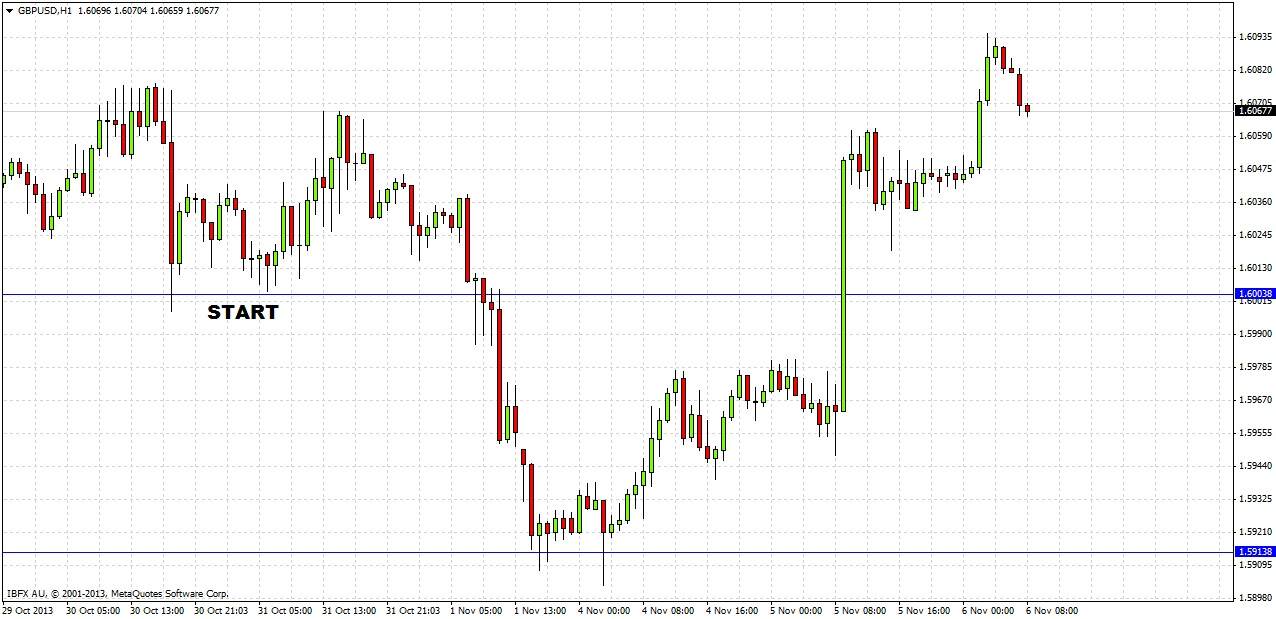
This was an excellent forecast, as can be seen from the 1 hour chart below:
The day of the forecast, 1.6000 did hold, though it was not actually touched as the daily low was 1.6004. It gave some resistance the next morning during the early part of the London session, before breaking down strongly, finally reaching 1.5902 very early on Monday morning, where it found solid support. As predicted, this zone has acted as strong support, and the price has now risen sharply since yesterday.
Of course, the overall bearish bias forecast has not been borne out this week so far.
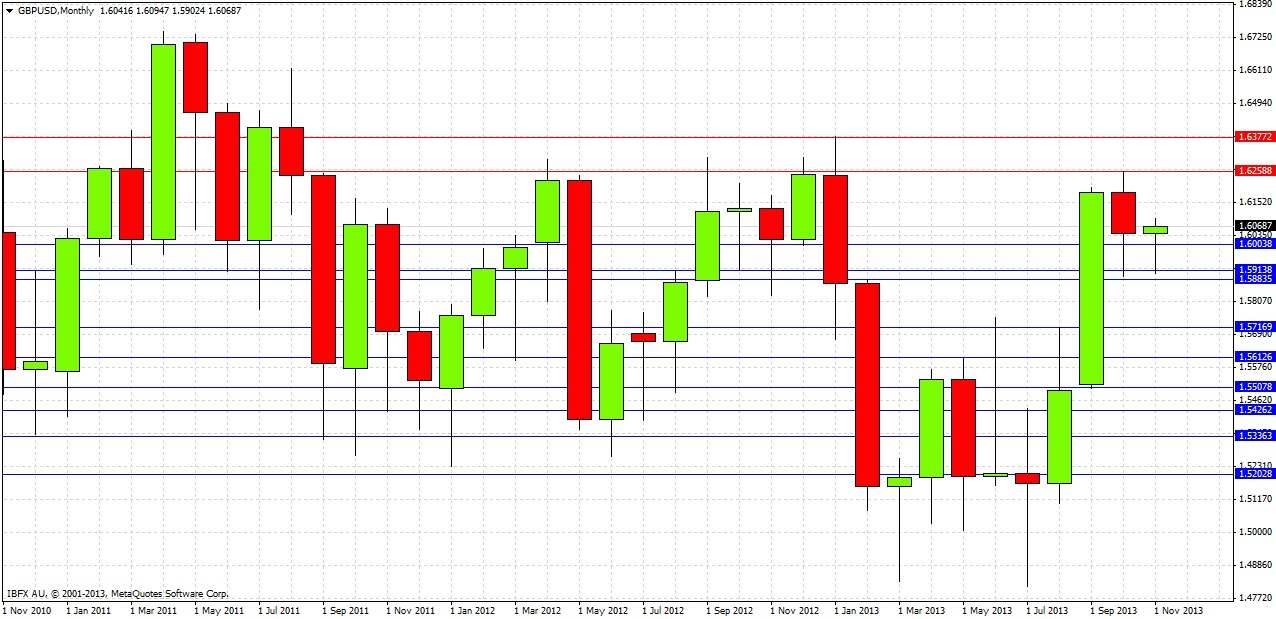
Looking to the future, let's start by examining the monthly chart:
Last month printed a bearish candle, though one showing plenty of support in its long lower wick, so it was not strongly bearish. It was the smallest ranging month of 2013. This is significant as the high of the candle touched the well-established resistance zone from 1.6250, signifying a lack of range due to a faltering of the uptrend. However it seems there is plenty of upwards momentum, but we cannot really see here whether there is enough strength for a true upwards breakout.
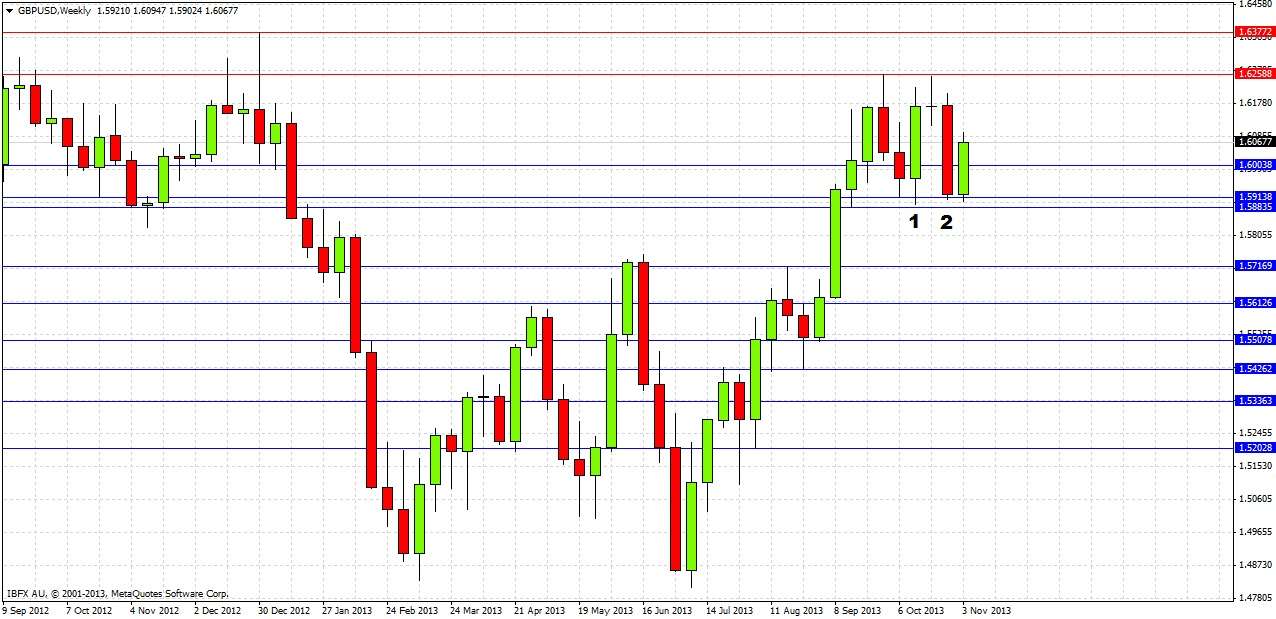
Let’s turn to the weekly chart now:
Last week produced a strongly bearish reversal candle, marked at (2). However, notice that the low of a previous bullish reversal candle marked at (1) has still not been broken down, and this week’s action so far has been strongly bullish. It seems clear that this zone from 1.5885 to 1.5914 is continuing to act as strong support, while the area above 1.6200 and especially 1.6250 continues to act as strong resistance.
The weekly chart shows that the pair has been consolidating over the past 5 weeks.
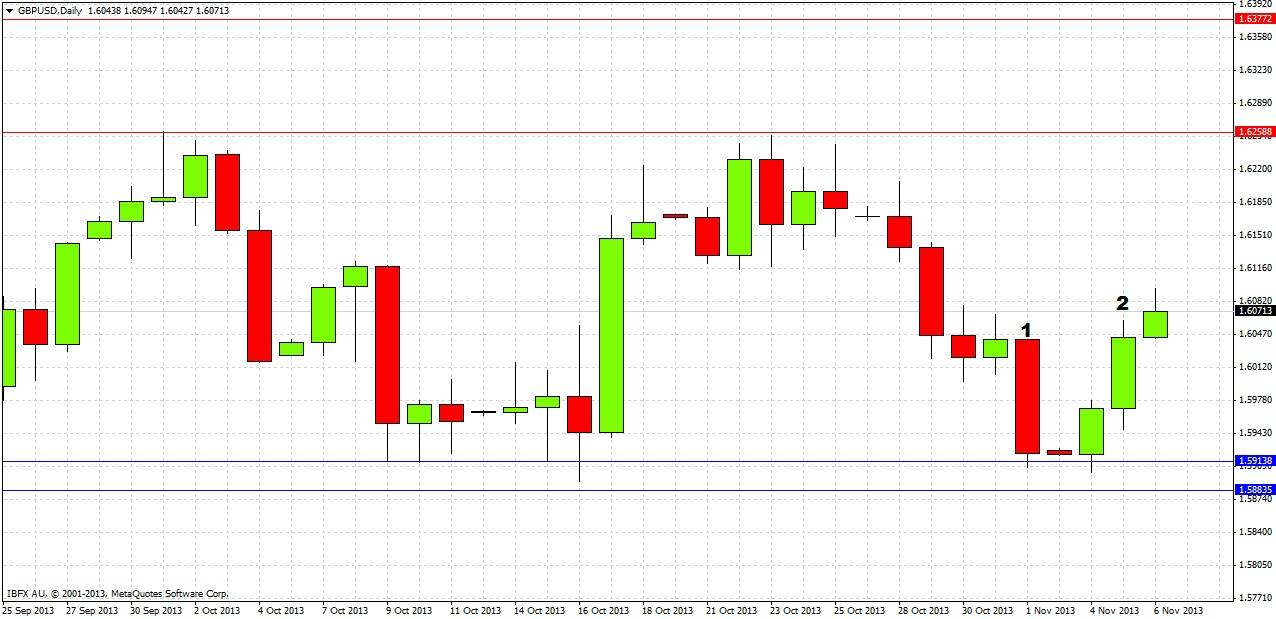
Now let’s take a look at the daily chart:
Last Friday produced a bearish reversal candle marked at (1), breaking the low of the previous day’s inside candle. This was bearish, but the support zone held firm, producing only bullish daily candles this week. This morning has seen a break of the high of the aforementioned inside candle, marked at (2).
It is clear the price is now trapped between strong resistance and support zones about 350 pips apart.
The conclusions and recommendations that can be drawn from our analysis are:
1. No overall directional bias, until there is a sustained break above 1.6250 (bullish) or below 1.5885 (bearish).
2. Touch trades possible during London sessions: long at 1.5900, short at 1.6250.
3. In the short term, a close today above 1.6075 should signal a rise to at least 1.6150 or thereabouts. A failure to rise above 1.6075 should lead to another fall back down to 1.5900.
4. A sustained break of 1.5885 to the downside should send price down to 1.5750 fairly quickly and possibly beyond.
5. A sustained break of 1.6250 to the upside will have unpredictable consequences until 1.6377 is surpassed, which would be an extremely bullish sign.


