Our previous analysis made on Wednesday last week ended with the following predictions:
1. This pair is one of the key pairs driving the Forex market and should continue to provide good trading opportunities.
2. There should be good opportunities to go long off the lower trend line (aggressive) or at the next retest of 97.75 (conservative).
3. If 97.75 is broken significantly to the down side, the price should reach 96.80.
4. Worth maintaining a bullish bias provided that 98.54 and the bullish channel hold.
5. Between 100.40 and 100.85 there should be good shorting opportunities.
6. Should the price break decisively through 100.85, it is likely to keep going up, all the way to 103.50.
7. Bullish progress can be monitored will be to watch whether the bullish channel's lower trend line or the triangle's upper trend line breaks first.
Taken overall, it is a very complex situation, so let’s try to judge this as clearly and as simply as possible. We can follow the commentary by looking at the daily chart below:
First of all, the price has not gone higher than 99.13, so none of the levels mentioned above that came into play.
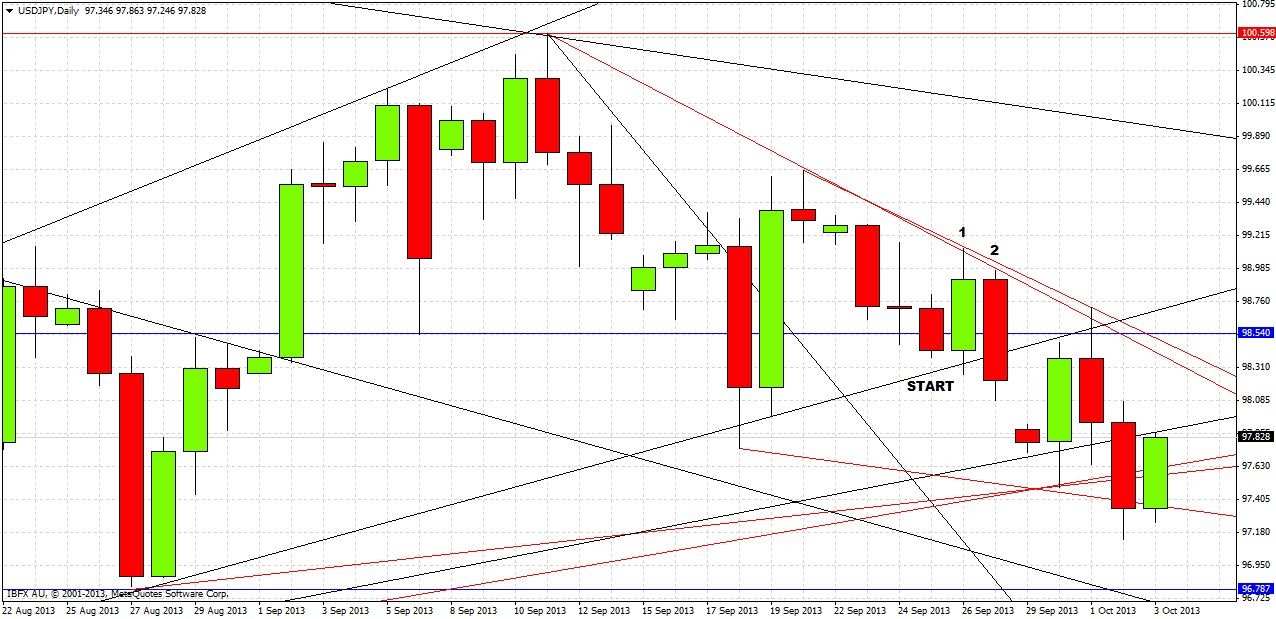
The very next day after the prediction, the price reached the lower trend line of the bullish channel, and penetrated it by only 5 pips before rising by a maximum total of 80 pips, hitting the upper trend line of a new bearish channel and reversing there to the pip (see the point marked 1 in the chart). So the aggressive long trade would have paid off well.
On Monday, 97.75 was tested, broken by 25 pips, and then rose to a maximum long gain of 97 pips, again hitting the upper trend line of the new bearish channel and reversing there to the pip (see the point marked 2 in the chart). So the conservative long trade could also have paid off with an appropriate stop.
This current week has seen a decisive break down through the bullish channel’s lower trend line, and 98.54, so this would suggest action has become bearish, and this has been reflected in the price action so far this week.
The price has not yet reached 96.80.
All in all, it was a very good and useful prediction.
Things are quite complex with this pair, so it is best to draw all the trend lines again from the top down, starting with the weekly chart:
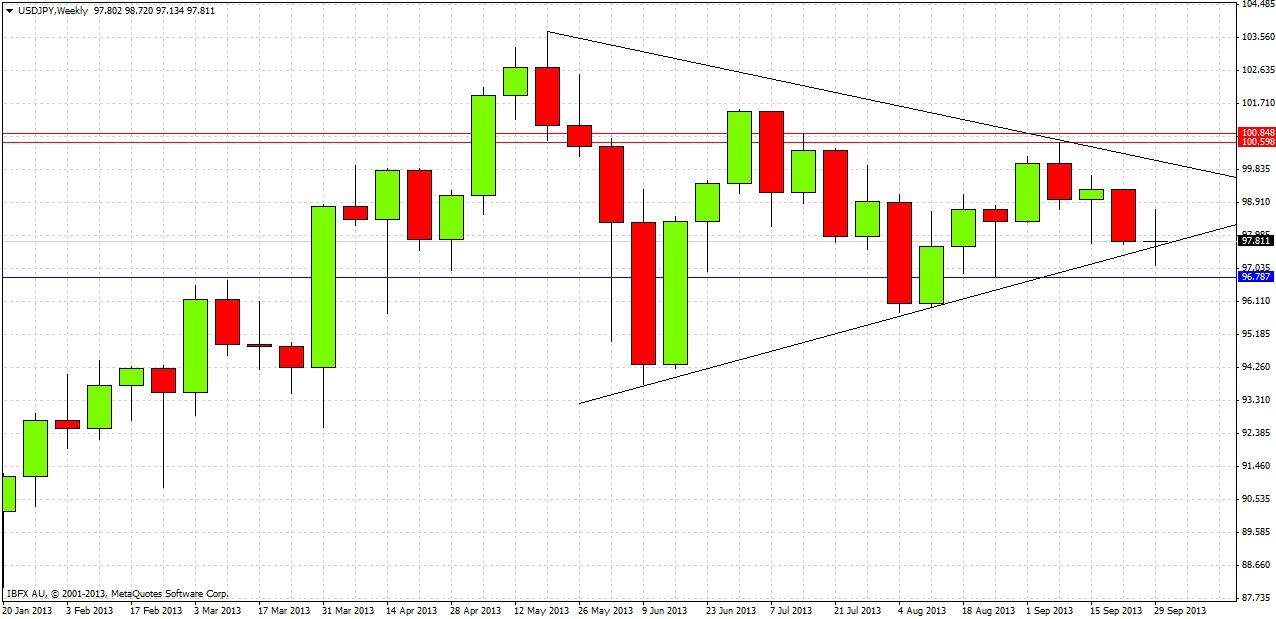
Interestingly, the most important thing we can see taking a long-term view of this pair, is that we have re-consolidated into a triangle pattern. The price is sitting right now on the lower trend line of the triangle, and last week was a bearish reversal. There is a significant support level below the triangle at around 96.75 to 97.00. There is strong resistance overhead from 100.40 to 100.85. September’s bullish breakout from the summer’s triangular range has been invalidated and may even be reversing into a bearish breakout from a new triangle.
We need more detail so let’s take another look at the daily chart
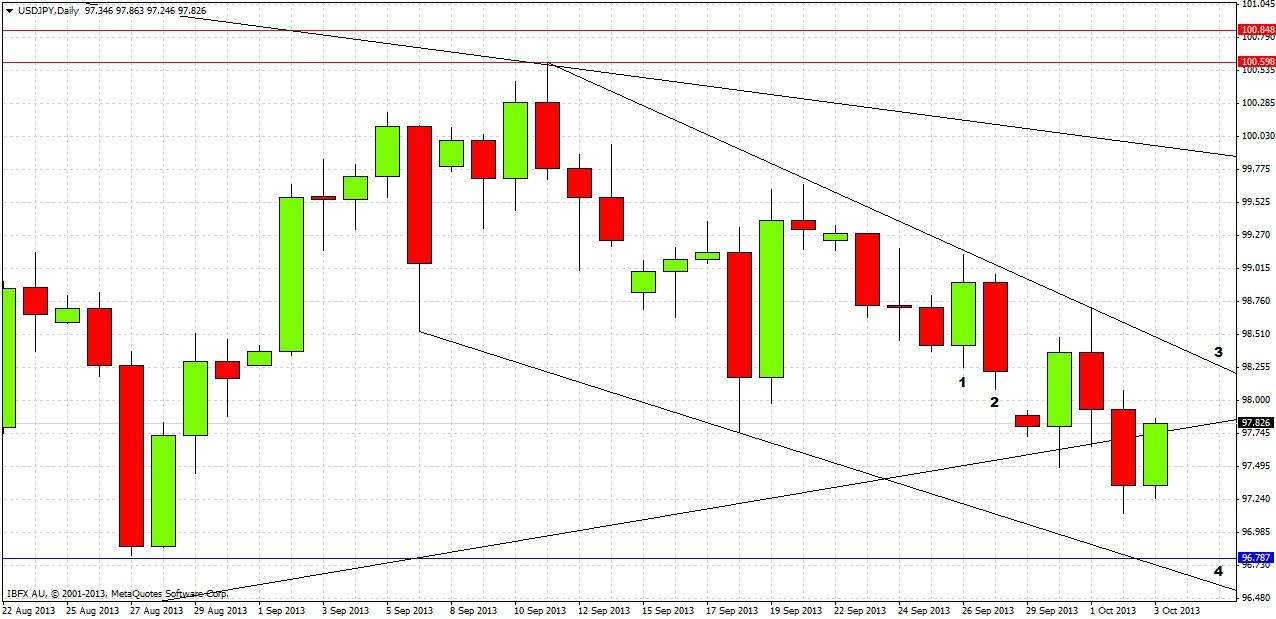
We can see some interesting things here. On Thursday last week a slightly weak bullish reversal candle was printed (marked at 1). Notice how its high was not breached, but its low was, by the next day’s bearish reversal candle (marked at 2): a bearish sign.
We can draw a shorter-term bearish channel (trend lines marked at 3 and 4). Notice how many days’ highs respected the upper trend line of this channel during the previous two weeks.
There is significant support below at around 96.78. This is above the channel’s lower trend line.
It is hard to make any predictions right now as the trend lines from the weekly chart are intact. If this week closes well below that lower trend line, and/or if 96.78 is broken significantly to the down side, or if the bearish channel’s lower trend line is not respected: these will all be bearish signs. If the bearish channel’s upper trend line is broken with a daily close well beyond it, or with two consecutive daily closes beyond it, that will be a sign that we should be heading back up to the upper weekly trend line.
In general, this pair has provided good trend line trading opportunities over recent weeks, so paying attention to the trend lines should help traders in trading this pair profitably.


