Our analysis exactly one week ago ended with the following predictions:
1. Weak bullish bias.
2. Look for longs at 1.6057.
3. An even better place to look for longs would be in the zone from 1.5900 to 1.5925.
4. There is strong overhead resistance, look for shorts or to exit longs at 1.6250.
5. No recommendations for touch trades.
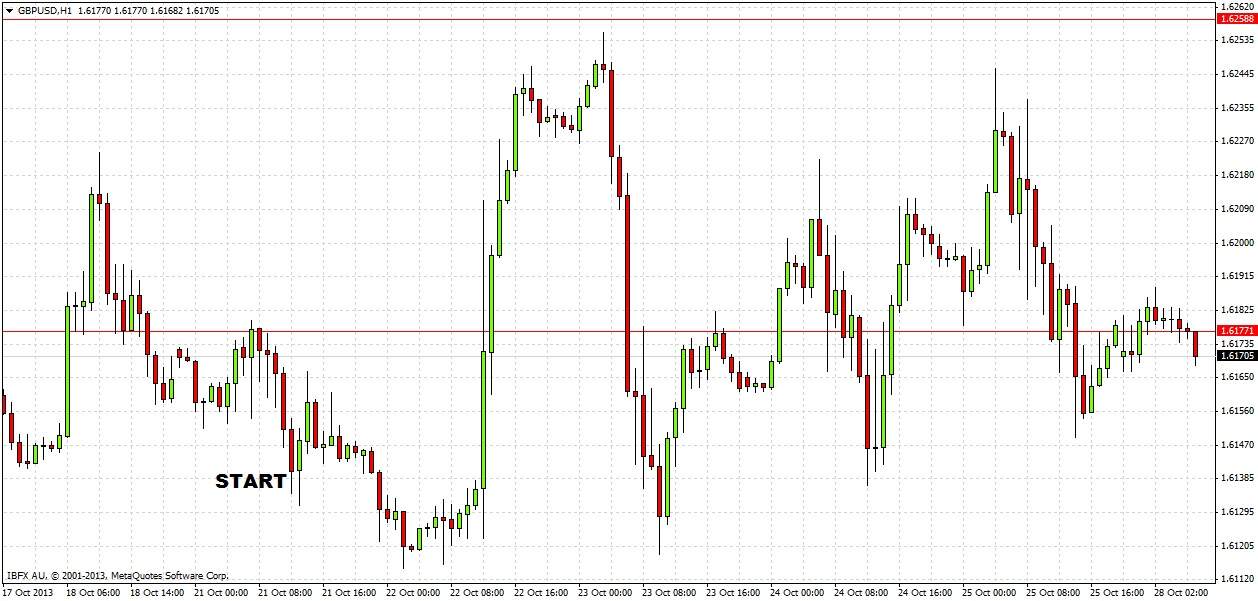
This was an accurate and useful forecast, as can be seen in the 1 hour chart below:
None of the levels mentioned were touched, except 1.6250 which did act as strong overhead resistance, and was the perfect place to go short or exit any longs. The bullish bias firstly took us up to 1.6250, with the pin bar on the 1 hour chart on the night of 23rd October signalling the short entry/long exit that was recommended. The price then moved in our favour by over 130 pips in a matter of hours, having penetrated 1.6250 by only 3 or 4 pips.
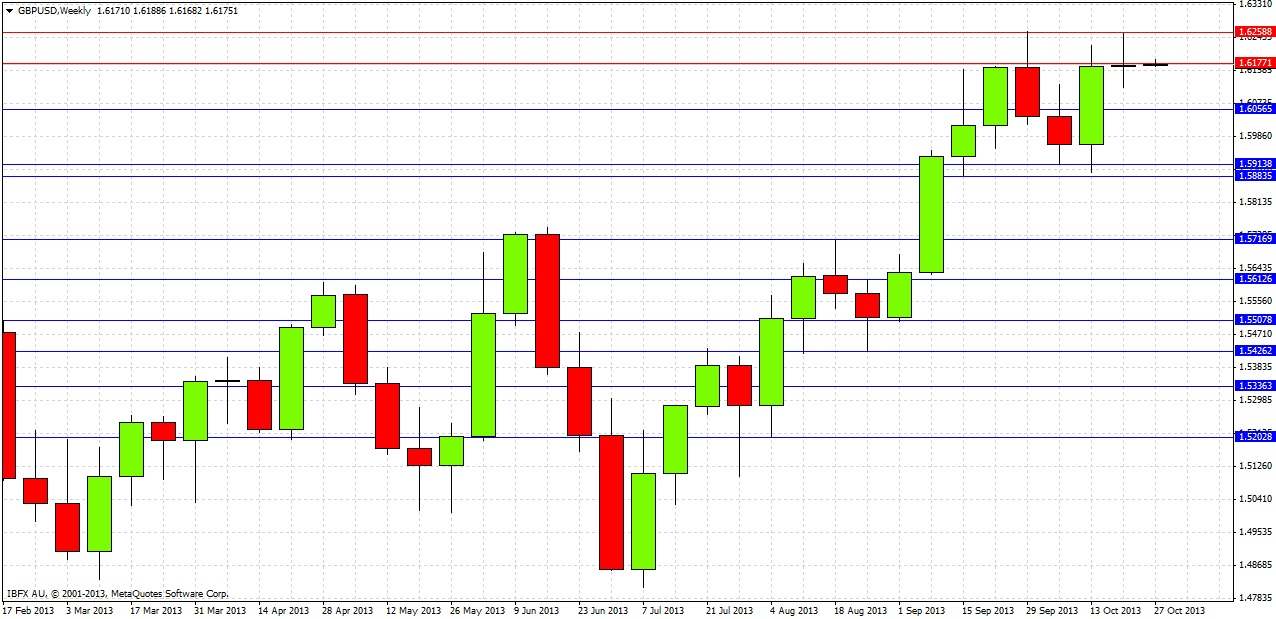
Looking to the future, let's start by examining the weekly chart:
Last week was a slightly bearish doji, the most significant things about it were its high (at almost exactly the expected 1.6250 resistance level) and its close, which was just below the resistance level at 1.6177. These are bearish signs but we need to make a closer analysis before drawing any conclusions.
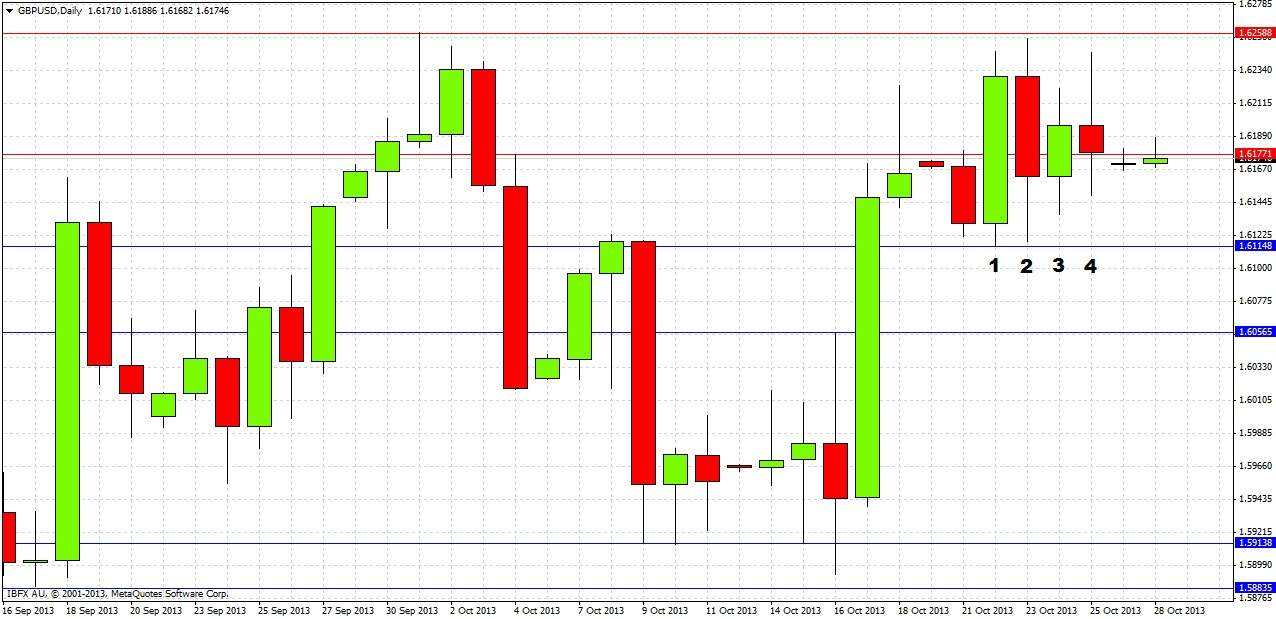
Let’s turn to the daily chart now for a more detailed look:
We can see that the action was pretty choppy last week. Tuesday produced a bearish reversal candle that closed near its high (1), and the low of this candle has not yet been broken, so we can say that this low of 1.6115 is acting as support. The following day the high of this candle was broken, but the price then fell sharply (2), printing an inconclusive inside candle the next day (3), was then broken inconclusively again to the upside on the following day (4), before closing the week just below the resistance at 1.6177. This week has also opened below this level.
It seems that we have formed a bearish double top at 1.6250 and that there is no momentum left in the pair to break higher than this for the time being. This leads to a cautious bearish bias that can be confirmed by a sustained break below last week’s low at 1.6115. This bias needs to be very cautious as we have been making higher lows since last Tuesday, as can be seen from the 1 hour chart above. In the absence of any significant news affecting the pound or the dollar, the price is likely to range between 1.6250 and 1.6115 for a while.
The only recommendations that can be made are:
1. Touch trade short under relaxed conditions at 1.6250.
2. Touch trade long under relaxed conditions at 1.6115.
3. A sustained break of 1.6250 to the upside should give a bullish bias up to 1.6377.
4. A sustained break of 1.6115 to the downside should give a bearish bias down to 1.6056 at least.
5. Should the price fall very sharply in a short period of time close to 1.5915, this should be a good level for a long touch trade.


