
By: Matt Fanning
A look at the technical indicators for USD/JPY without the distraction of fundamentals and macro will paint an interesting picture that is certainly worth looking at. Let’s take a look at the technicals on the USD/JPY currency pair, and price levels on the long and short side.
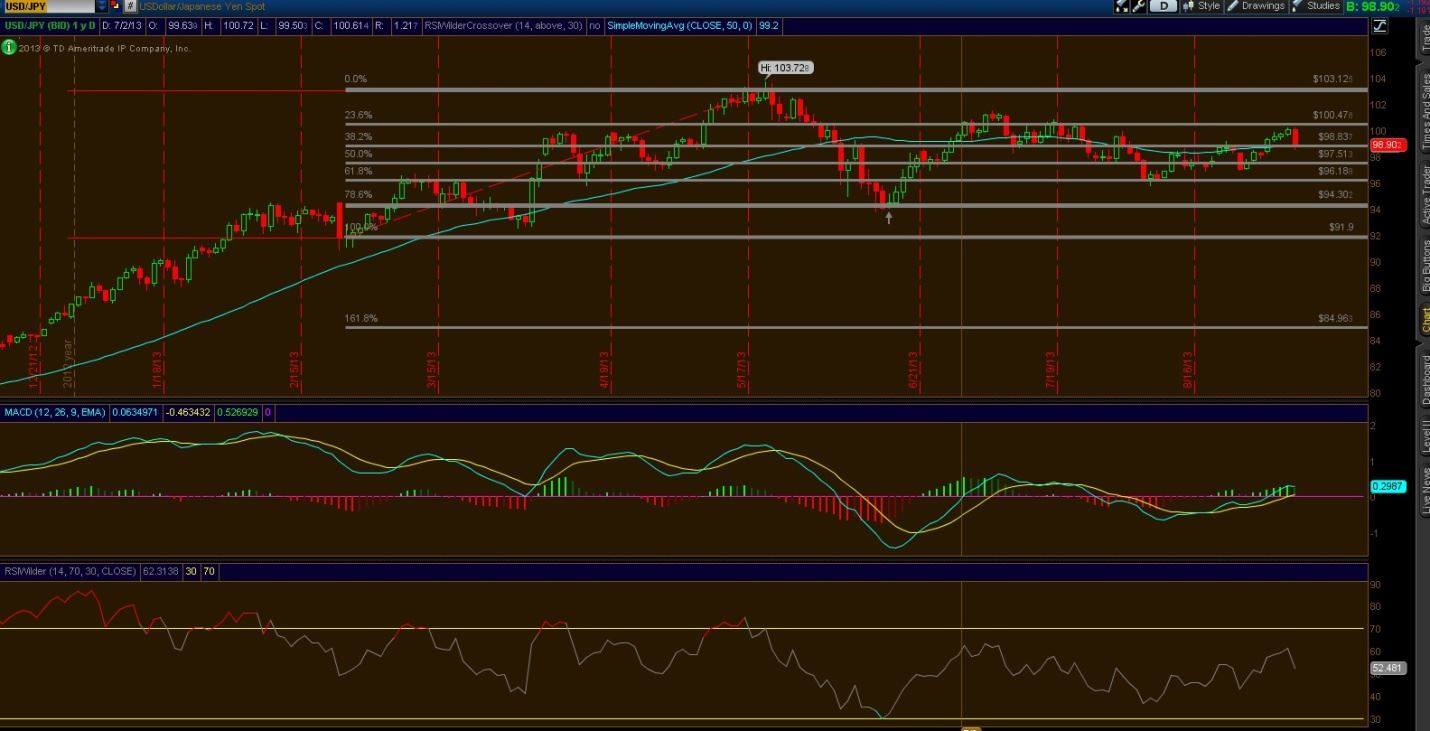
Starting with Fibonacci retracement levels, YEN is exactly sitting on its 38.2% Fib level, using 103.10 as the closing high on 5/22. Importantly as well, this pullback completely engulfs over 3 days of gains, now working on taking a 4th day of buying out. To add more weight on current levels is the 50 day, which is also right here at 98.81. This support level will be extremely important over the next few sessions. If we can hold, 100.47 is back in the picture, with 100.10 as first level of resistance.
Looking at MACD and RSIWilder, both indicators seem to be more on the bullish side, but Friday’s pullback is testing that trend as well. For the short term, a hold on price will also hold this possible break down, and continue back on a bullish trend. On a larger channel, the pair is in a range between 91.90 and 103.13. Most important support level looks to be the 61.8% Fib level of 96.31, which held and bounced perfectly in early August. The pair needs to get thru 101.10, resistance on 7/9, to make an attempt at that 103 level.
My next chart digs a bit deeper into the technicals. Starting with the indicators, Slow Stochastics, we made a new high in a bullish trend, but with Friday’s pullback, it’s starting to show oversold. A break in price could make it break lower thru the important 80 level, which could mean the start of some major selling pressure. TQI (Trend Quality) has been flat, which makes sense since the YEN had been trading into a tighter range. This, as well as that range, seems it wants to break out, and break out soon.
Stochastics looks better for the bulls then the Slower Stoch. Currently in oversold levels, it is not breaking down yet in any way, and not showing and sell signals. Lastly is relative strength. Outside of Friday, RSI was in a strong bull trend. If price can hold, it can get that trend back and try to break through it to higher levels. No direct sell signals so it’s currently still more bullish then bearish. Looking at price levels, YEN is currently in a strong triangle pattern, mostly symmetrical with lower highs and higher lows. It bounced down on Friday from 100.17; low support on this would be 97.50. If we stay in this now bound up range, a break out, higher or lower, will be more and more due to happen. YEN is also directly on its shorter term 14 & 30 day averages, which also happens to be where the 150 day is.
A break would test that 97.50 level, with 96.60 being even more important support. If or when we break out of this triangle, would look to 100.10 for first resistance, then the 103 handle. For support, look for 96.60, then to 94, with longer term support at 93.
